Ignite Your Team's Ideas
Tired of unproductive brainstorming sessions? Remote teams can struggle with collaboration, but the right tools can transform virtual meetings into idea powerhouses. This listicle showcases eight powerful brainstorming graphic organizers to unlock your team's creativity and boost collaboration. Discover how these visual tools provide structure and encourage participation, helping your team effectively tackle any challenge – from product development to problem-solving. Learn how mind maps, concept maps, fishbone diagrams, and more can transform your brainstorming.
1. Mind Map
Mind maps are a powerful brainstorming graphic organizer perfectly suited for remote teams, tech teams, and startups looking to generate innovative ideas and solve complex problems collaboratively. As a radial diagram starting with a central concept and branching outward with related ideas, a mind map visually represents the connections between different thoughts. This non-linear approach mimics how our brains naturally connect information, fostering free association and spontaneous idea generation, making it a highly effective brainstorming tool. It's a great way to get everyone on the same page, no matter their location. Whether you're kicking off a new project, troubleshooting a technical issue, or searching for the next big feature, mind maps can facilitate a productive brainstorming session.
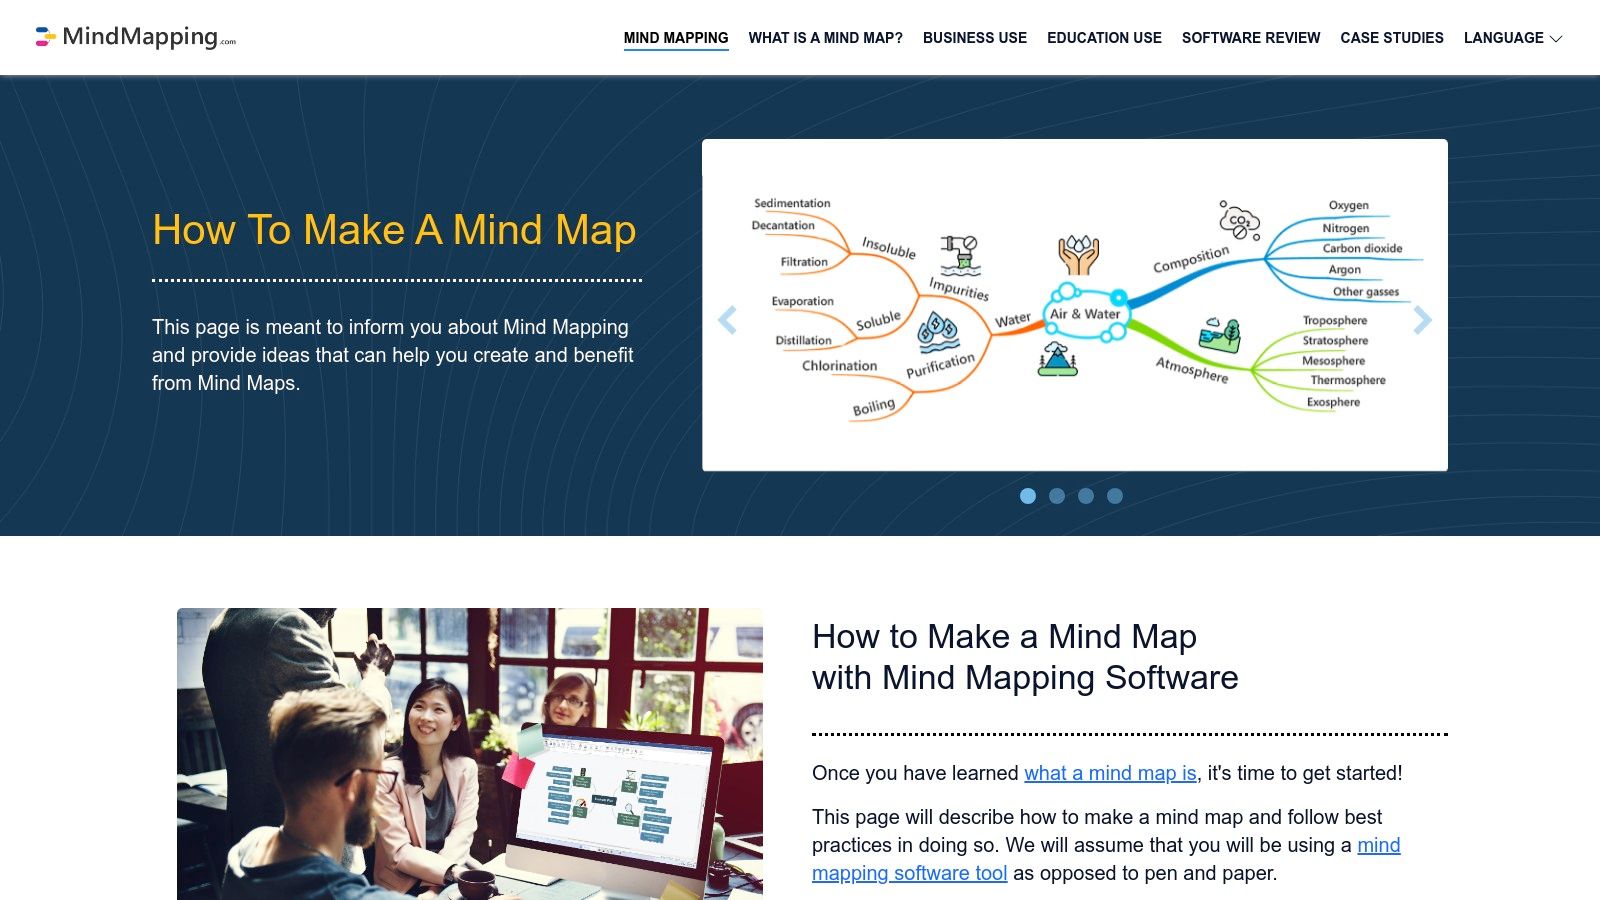
The hierarchical structure of a mind map, with its main and sub-branches, allows for the exploration of ideas at different levels of detail. Using colors, images, and symbols further enhances memory retention and makes the mind map more engaging. The flexibility to add new connections anywhere in the structure supports both divergent thinking (exploring a wide range of ideas) and convergent thinking (narrowing down to the best solutions). For remote teams, this flexibility is especially valuable, allowing team members to contribute asynchronously and build upon each other's ideas regardless of time zones.
Features:
- Central concept with radiating branches: Provides a clear focal point for the brainstorming session.
- Hierarchical structure: Organizes ideas logically and shows relationships between concepts.
- Visual elements: The use of colors, images, and symbols boosts engagement and aids recall.
- Flexible structure: Allows for easy addition of new ideas and connections at any point.
- Supports both divergent and convergent thinking: Facilitates both expansive idea generation and focused refinement.
Pros:
- Visually engaging and easy to understand: Facilitates quick comprehension of complex ideas.
- Encourages creative thinking and unexpected connections: Promotes out-of-the-box solutions.
- Can accommodate unlimited ideas and relationships: Scalable for any brainstorming project.
- Helps with memory retention: Visual associations strengthen memory recall.
Cons:
- Can become cluttered: Requires careful planning and organization to prevent visual overload, especially in larger brainstorming sessions.
- Challenging for linear thinkers: The non-linear format may require some adjustment for those accustomed to traditional brainstorming methods.
- Less structured: May not be suitable for highly structured projects requiring a rigid framework.
- Time-consuming to create manually: Digital mind mapping tools can mitigate this.
While creating a mind map by hand can be time-consuming, numerous digital tools simplify the process and enable real-time collaboration for remote teams. Free mind mapping tools like XMind (freemium) and FreeMind offer basic functionalities, while paid options like MindManager provide advanced features for professional use. These digital platforms also offer features like cloud storage, version control, and export options, making them ideal for collaborative brainstorming in remote settings.
MindManager, while a paid option, offers integrations with Microsoft Office and other productivity tools commonly used by tech teams. Pricing can vary depending on the chosen plan and whether you opt for a single user or team license. FreeMind, being open-source, requires no financial investment but may have a steeper learning curve. Explore the options and choose the one that best suits your team's needs and budget.
This brainstorming graphic organizer deserves its place on this list because it effectively combines visual thinking, flexible structure, and ease of use, making it an excellent choice for remote teams, especially in the fast-paced tech startup environment. Check out more information on mind mapping at https://www.mindmapping.com.
2. Concept Map
A concept map is a powerful brainstorming graphic organizer that goes beyond simple idea generation. It excels at clarifying the relationships between your ideas. Instead of just listing thoughts, concept maps visually structure information by explicitly showing how different concepts connect, making them ideal for complex projects requiring a deep understanding of multiple interconnected ideas. This makes concept mapping especially useful for remote teams who need to align their understanding of complex projects, troubleshoot issues collaboratively, or develop intricate strategies.

Concept maps use boxes or circles to represent individual concepts, linked by labeled lines that explain the relationship between them. These linking phrases form "propositions," clarifying how one concept relates to another (e.g., "causes," "leads to," "requires"). The structure can be hierarchical, starting with a central idea and branching out to more specific concepts, but importantly, concept maps also allow for cross-links between different branches. This ability to visualize non-linear relationships sets them apart from mind maps and is crucial for unpacking multifaceted challenges. For remote tech teams tackling complex coding projects or remote startups developing intricate business models, this ability to visually represent interdependencies is invaluable for both planning and problem-solving.
Features and Benefits for Remote Teams:
- Visualizing Complex Relationships: Concept maps shine when exploring the intricate web of factors involved in a project. For remote teams, this shared visual understanding is crucial for efficient collaboration and minimizes miscommunication.
- Identifying Gaps and Misconceptions: The process of creating a concept map forces teams to explicitly define relationships between ideas. This can highlight gaps in knowledge, conflicting assumptions, and potential misunderstandings early in a project.
- Collaborative Brainstorming: Concept mapping is highly effective for collaborative brainstorming, especially in remote settings. Teams can use online tools to co-create maps, ensuring everyone is on the same page and contributing their unique perspectives.
- Structured Knowledge Sharing: Concept maps serve as excellent documentation for project knowledge, making it easier for new team members to get up to speed quickly or for existing teams to revisit complex information.
Pros:
- Excellent for showing complex relationships between ideas
- Helps identify misconceptions and gaps in understanding
- Provides clear visual representation of knowledge structures
- Useful for both individual and collaborative brainstorming
Cons:
- More complex to create than simple mind maps
- Requires more thoughtful planning of relationships
- Can become visually overwhelming with many cross-connections
- Less intuitive for purely creative brainstorming sessions
CmapTools (https://cmap.ihmc.us): CmapTools is a free, dedicated software specifically designed for creating concept maps. It offers a range of features for collaborative map building, sharing, and publishing, making it a valuable resource for remote teams. While other diagramming software can be used, CmapTools' specialized focus makes it a powerful option for complex brainstorming graphic organizer needs.
Implementation Tips for Remote Teams:
- Start with a Clear Goal: Define the specific challenge or question you want to address with your concept map.
- Use Collaborative Tools: Leverage online whiteboards or dedicated concept mapping software like CmapTools for real-time co-creation.
- Keep it Focused: Avoid overcrowding the map. Start with key concepts and gradually expand, ensuring clarity and readability.
- Regularly Review and Update: As your project evolves, revisit and update your concept map to reflect new knowledge and changes in direction.
Concept maps are a valuable tool for brainstorming graphic organizer needs, particularly for remote teams, offering a structured and visual way to understand complex relationships, identify potential pitfalls, and foster shared understanding in a collaborative environment. They earn their place on this list due to their ability to go beyond simple idea association and delve into the intricate connections that underpin successful projects.
3. Fishbone Diagram (Ishikawa)
The Fishbone Diagram, also known as the Ishikawa or Cause-and-Effect Diagram, is a powerful brainstorming graphic organizer specifically designed for identifying the root causes of a problem. It's particularly well-suited for remote teams, tech teams, and startups tackling complex issues, facilitating collaborative troubleshooting and problem analysis even when team members are geographically dispersed. By visually organizing brainstormed ideas into categories, it streamlines the process of identifying contributing factors to a central issue. This makes it exceptionally useful for troubleshooting bugs, analyzing project roadblocks, or conducting quality improvement brainstorming sessions within a remote work environment.
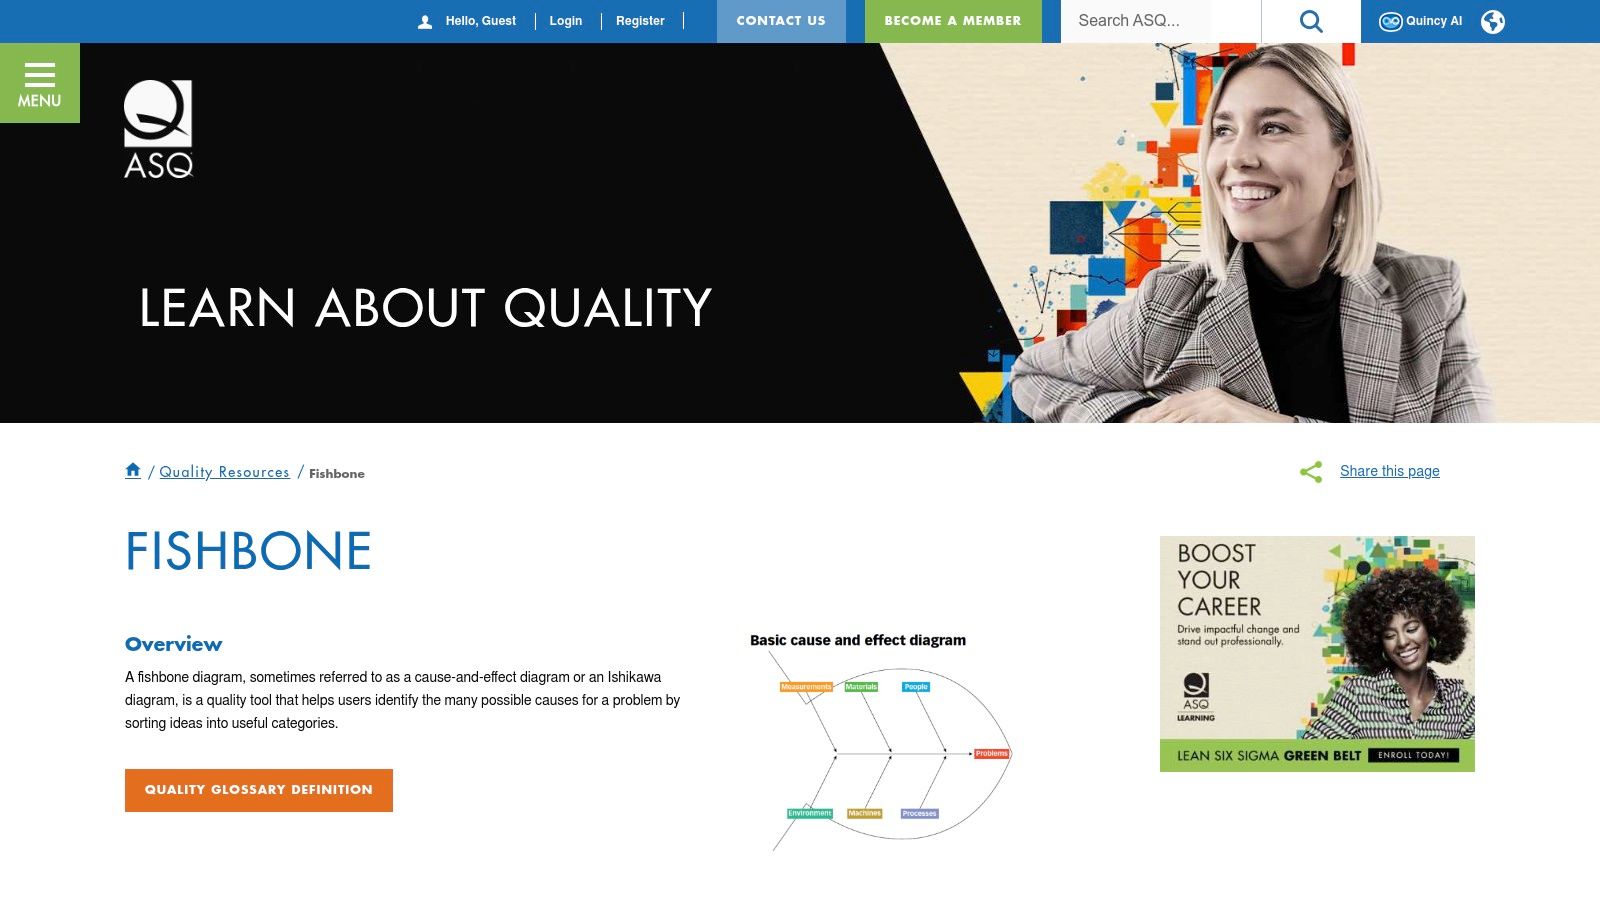
The Fishbone Diagram's structure is simple yet effective. The central problem or effect is placed at the "head" of the fish. Major cause categories, represented as "bones" branching from the spine, organize potential causes into logical groups. Common categories include the 6M framework (Man, Machine, Material, Method, Measurement, Environment), but other frameworks can be tailored to the specific situation. Specific causes are then added as sub-branches off each major category, creating a hierarchical breakdown of cause-effect relationships. This visual representation helps remote teams quickly grasp the complexities of a problem and identify areas requiring further investigation. For instance, a remote tech team troubleshooting a software bug could use the categories "Code," "Testing," "Deployment," and "Environment" to categorize the potential causes.
The Fishbone Diagram earns its place in this list of brainstorming graphic organizers due to its targeted approach to problem-solving. While other tools might excel at open-ended brainstorming, the Fishbone Diagram provides a structured approach for digging deep into the why behind a problem. This makes it invaluable for remote tech teams and startups needing to quickly identify and resolve issues. Learn more about Fishbone Diagram (Ishikawa) to explore further applications.
Pros:
- Excellent for problem-focused brainstorming sessions.
- Provides a structured approach to identifying multiple cause factors.
- Helps organize complex issues into manageable categories.
- Visually distinguishes between different types of causes.
Cons:
- Less effective for open-ended, creative brainstorming.
- Requires some initial understanding of potential cause categories.
- Can oversimplify complex problems with multiple interrelated causes.
- Not ideal for generating solutions (focuses on causes only).
Website: https://asq.org/quality-resources/fishbone
Pricing and Technical Requirements: The Fishbone Diagram is a simple tool that doesn’t require any specific software. It can be created using a whiteboard, flip chart, or even a shared digital document. Many free online templates and diagramming tools are available.
Implementation Tips for Remote Teams:
- Use a collaborative online whiteboard tool to allow all team members to contribute to the diagram simultaneously.
- Clearly define the problem statement at the "head" of the fish before brainstorming begins.
- Agree on the major cause categories collaboratively to ensure everyone is on the same page.
- Encourage active participation from all team members to gather diverse perspectives.
- Once the diagram is complete, prioritize the most likely causes for further investigation.
This structured approach makes the Fishbone Diagram an effective tool for brainstorming graphic organizers, particularly within the context of remote teamwork.
4. Bubble Map
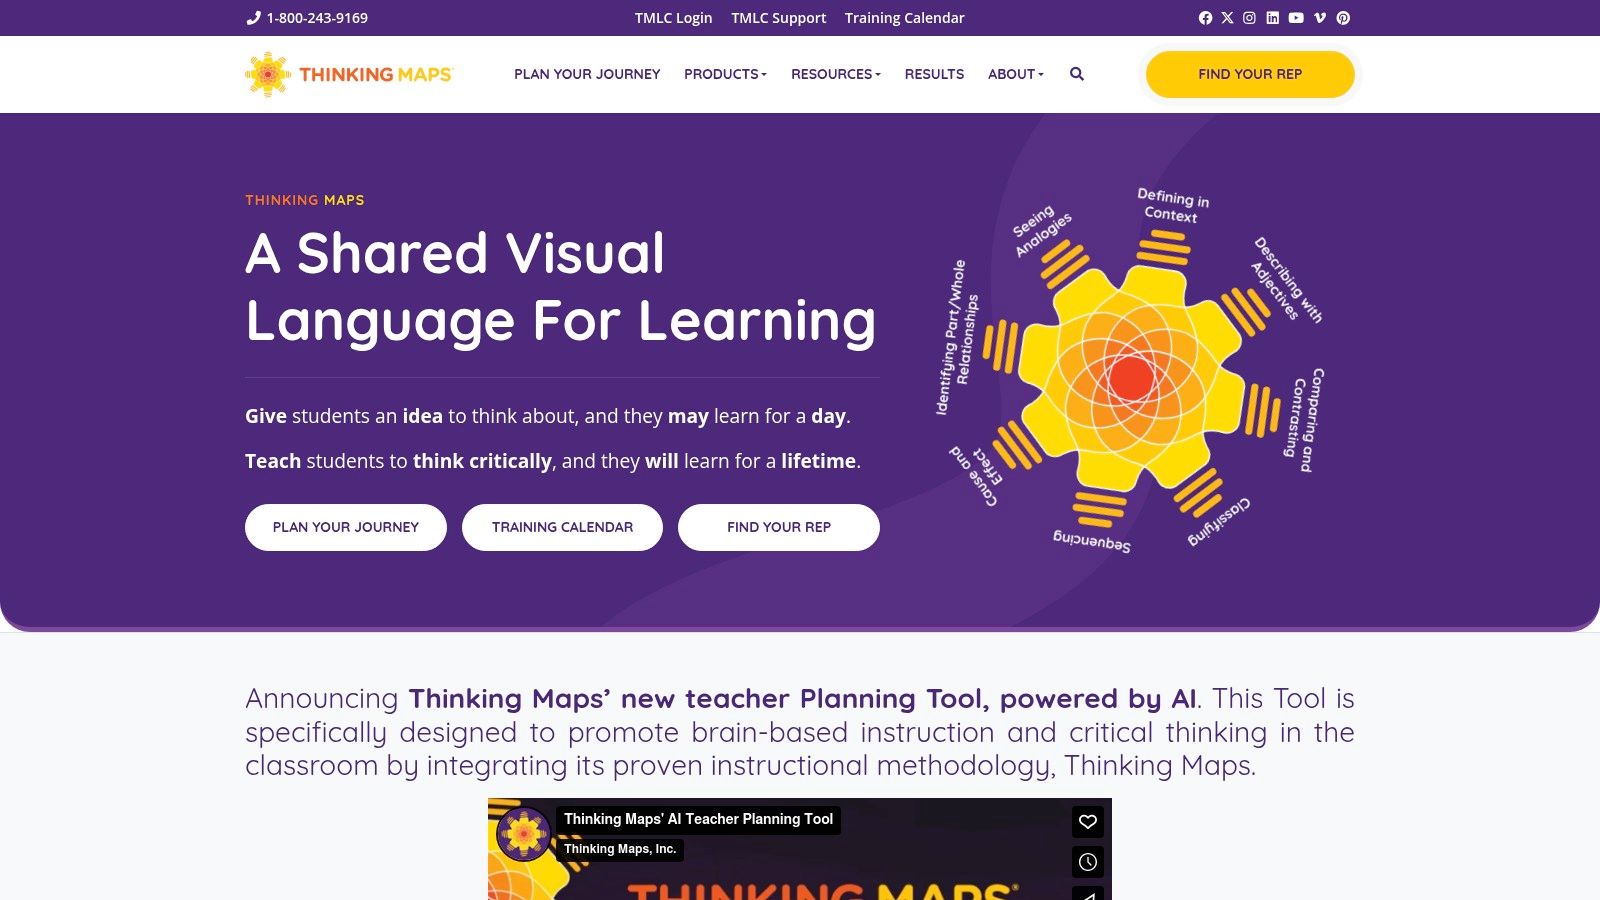
The Bubble Map is a brainstorming graphic organizer perfect for descriptive brainstorming sessions. As part of the Thinking Maps® suite developed by Dr. David Hyerle, it uses a simple visual format of interconnected bubbles to explore the attributes and qualities of a central concept. This makes it an excellent tool for remote teams, particularly in tech and startup environments, who need a quick and easy way to describe a product, feature, or problem. This brainstorming graphic organizer allows teams to quickly generate and share ideas, even when working remotely.
The central bubble contains the main topic, while surrounding bubbles branch out containing descriptive words or phrases. For example, if a remote tech team is brainstorming the features of a new mobile app, the central bubble might be "Mobile App," with surrounding bubbles containing descriptors like "user-friendly," "intuitive navigation," "secure login," "offline functionality," and "cross-platform compatibility." This simple, uncluttered visual format makes it easy to see the core concept and its associated qualities at a glance. Furthermore, color-coding can be implemented to categorize different types of attributes, adding another layer of organization to your brainstorming session. For instance, features related to user interface could be green, security features blue, and performance features orange. This helps remote teams quickly identify and discuss related attributes during virtual meetings.
Features and Benefits:
- Simplicity: Extremely easy to create and understand, making it ideal for quick brainstorming sessions and for teams with varying levels of experience with graphic organizers. No special software or technical skills are required, making it accessible to all remote team members.
- Descriptive Brainstorming: Excels at adjective-based brainstorming, making it perfect for describing the characteristics of a product, service, or problem.
- Flexibility: Easy to expand upon by adding additional levels of bubbles for more in-depth exploration of attributes. This adaptability is particularly useful for remote tech teams working on complex projects.
- Visual Clarity: The uncluttered visual format makes it easy for remote teams to grasp the core concept and its related attributes during online brainstorming sessions.
Pros:
- Simple to create and understand
- Works well for beginners
- Excellent for descriptive brainstorming
- Can be quickly sketched without special tools
Cons:
- Limited in showing complex relationships between ideas
- Less structured than other organizational tools
- Not ideal for process-based or sequential thinking
- Can become cluttered if too many bubbles are added
Implementation Tips:
- Start with a clear central topic.
- Use concise words or phrases in the surrounding bubbles.
- Utilize color-coding to categorize attributes.
- Limit the number of bubbles to avoid clutter.
- Consider using a digital whiteboard for collaborative remote brainstorming.
While Bubble Maps may not be suitable for complex relationship mapping, their simplicity and focus on descriptive brainstorming make them a valuable tool for remote teams, especially in the fast-paced world of tech startups. This brainstorming graphic organizer ensures everyone can participate effectively, regardless of location or technical expertise. More information on Thinking Maps® can be found at https://www.thinkingmaps.com.
5. SWOT Analysis Matrix
The SWOT Analysis Matrix is a powerful brainstorming graphic organizer that helps teams dissect a project, business idea, or even their own team dynamics. It's a versatile tool, particularly useful for remote teams who need a structured way to collaborate and analyze situations from different perspectives. This matrix divides the brainstorming process into four key areas: Strengths, Weaknesses, Opportunities, and Threats, providing a 360-degree view of the subject at hand. This comprehensive approach makes it ideal for strategic planning and informed decision-making, ensuring remote teams consider all angles before moving forward.
The SWOT matrix's four-quadrant structure facilitates a balanced consideration of both internal and external factors. Strengths and Weaknesses focus internally, prompting reflection on the resources, skills, and potential shortcomings within the team or project. Opportunities and Threats look outward, examining the external landscape for potential advantages and challenges. This framework is particularly useful for remote startups looking to assess their competitive landscape or remote tech teams evaluating a new technology. For example, a remote tech team might use a SWOT analysis to decide whether to adopt a new programming language, considering their team's existing skills (Strengths/Weaknesses) and the language's popularity and community support (Opportunities/Threats).
This brainstorming graphic organizer is simple to implement, requiring no specialized software or technical expertise. Its grid format makes it accessible to participants with diverse backgrounds, fostering inclusivity within remote teams. Simply create a 2×2 grid, label each quadrant accordingly, and begin brainstorming. Teams can collaborate on a shared digital whiteboard or document, allowing everyone to contribute in real-time, regardless of location. Learn more about SWOT Analysis Matrix for further insights into applying this technique in ideation sessions. The simplicity of the SWOT matrix also means there's no cost involved—it's a free brainstorming graphic organizer available to everyone.
While the SWOT analysis offers numerous benefits, including comprehensive analysis and structured decision-making, it's important to be aware of its potential limitations. It can sometimes oversimplify complex situations and doesn't inherently prioritize the identified factors. It also provides a static snapshot of a particular point in time, without accounting for how those factors might evolve. Therefore, it's crucial to remember that the SWOT analysis is a starting point for deeper discussion and should be combined with other tools for a more robust and dynamic understanding. For example, after conducting a SWOT analysis, a remote team might use a prioritization matrix to rank the identified factors and focus their efforts on the most impactful ones. This combined approach allows teams to leverage the comprehensive nature of the SWOT analysis while mitigating its limitations. You can find more resources on effective brainstorming and strategic planning at https://www.mindtools.com/pages/article/newTMC_05.htm.
6. Ladder Diagram (Sequence Chart)
A Ladder Diagram, also known as a Sequence Chart, earns its place on this list of brainstorming graphic organizers as a powerful tool for process-oriented brainstorming. This method excels when your remote team needs to map out a sequence of events, a step-by-step procedure, or a workflow, making it especially relevant for remote tech teams and startups developing new products or services. Using a Ladder Diagram helps ensure everyone understands the chronological order of operations and can identify potential bottlenecks or missing steps early in the planning process. It's a great way to bring structure to your brainstorming sessions and ensure a shared understanding of complex processes.
This brainstorming graphic organizer organizes information vertically, resembling a ladder, where each "rung" represents a step in the sequence. This visual representation facilitates a clear understanding of the process flow from beginning to end.
Features and Benefits:
- Vertical, Sequential Structure: The ladder format visually emphasizes the chronological order of steps, promoting a logical flow of ideas. This is particularly helpful when brainstorming complex procedures where the sequence is crucial.
- Clear Visualization of Process Flow: The diagram clearly illustrates the progression of steps, allowing remote teams to easily visualize the entire process from start to finish. This shared vision helps prevent misunderstandings and ensures everyone is on the same page.
- Branching Capabilities: Some Ladder Diagram tools allow for branching paths, accommodating alternative sequences or conditional steps within the overall process. This flexibility is beneficial for exploring "what-if" scenarios or variations in a workflow.
- Detailed Sub-steps: Expand on each main step by adding sub-steps or details directly onto the diagram. This granularity provides a comprehensive overview of the entire process and encourages a thorough brainstorming session.
- Ideal for Instructional Content: The clear and structured nature of a Ladder Diagram makes it a perfect tool for developing instructional materials, user manuals, or training documentation.
Pros:
- Excellent for process-oriented brainstorming
- Helps identify gaps or missing steps in sequences
- Makes chronological relationships clear and visible
- Good for developing instructional or procedural content
Cons:
- Limited for non-linear or associative thinking. For more free-form brainstorming sessions, mind mapping might be a better approach.
- Not ideal for exploring multiple related concepts concurrently.
- Can constrain creative thinking due to the linear format. If your goal is to generate innovative, out-of-the-box ideas, consider using techniques like the Starbursting method.
- Less effective for open-ended brainstorming.
Implementation and Setup Tips for Remote Teams:
- Collaborative Whiteboard Tools: Utilize collaborative online whiteboards like Lucidchart (linked below), Miro, or Mural to create and edit Ladder Diagrams together in real-time, even when team members are geographically dispersed. This allows for seamless collaboration and ensures everyone can contribute.
- Start with the Goal: Before diving into the steps, clearly define the overall goal or objective of the process you are mapping. This provides context and direction for the brainstorming session.
- Break Down Complex Steps: Don't hesitate to break down larger steps into smaller, more manageable sub-steps. This promotes clarity and facilitates a more detailed understanding of the process.
- Assign Roles: For larger projects, consider assigning roles within the brainstorming session. One person could act as the facilitator, guiding the discussion, while others focus on contributing ideas and documenting the steps on the diagram.
- Regularly Review and Refine: After the initial brainstorming session, review and refine the Ladder Diagram as needed. This iterative approach ensures the diagram accurately reflects the desired process and addresses any gaps or issues.
Website: Lucidchart – Ladder Diagrams (Note: Lucidchart offers various pricing plans, including free and paid options. Specific technical requirements are dependent on the chosen platform and collaboration tools.)
By leveraging the structured format of a Ladder Diagram, remote teams, particularly those in tech and startup environments, can effectively brainstorm processes, identify potential roadblocks, and create a shared vision for project execution. This clear visualization of sequential steps contributes significantly to improved communication and collaboration, leading to more efficient and successful outcomes.
7. Lotus Blossom Diagram
The Lotus Blossom Diagram earns its spot on this list of brainstorming graphic organizers as a powerful tool for deep dives into complex topics. While simpler brainstorming methods might suffice for quick ideation sessions, remote teams, especially those in tech startups, often face multifaceted challenges requiring a more structured and thorough approach. This is where the Lotus Blossom Diagram shines. It’s a particularly effective brainstorming graphic organizer for remote tech teams and startups grappling with intricate problems that demand a systematic exploration of potential solutions.
Developed by Yasuo Matsumura, this technique takes its name from its resemblance to a blooming lotus flower. At the center lies your core problem or concept. Surrounding this central idea are eight "petals," each representing a main theme or category related to the central topic. Each of these eight petals then becomes the center of its own lotus blossom, with eight sub-topics branching out. This structured framework generates a total of 64 related ideas, ensuring comprehensive coverage of the subject.
How it works for Remote Teams:
Imagine a remote tech team brainstorming features for a new SaaS product. The central idea in the Lotus Blossom Diagram could be "Improve User Engagement." The surrounding eight petals might then represent categories like "User Interface," "Onboarding Process," "Customer Support," "Gamification," "Content Marketing," "Community Building," "Performance Optimization," and "Personalization." Each of these categories then becomes a central topic for further brainstorming, generating eight specific ideas related to each. For example, under "User Interface," sub-topics might include "Simplified Navigation," "Dark Mode Option," "Interactive Tutorials," and so on. This allows the team to systematically explore all facets of user engagement, resulting in a rich pool of potential features.
Features and Benefits:
- Structured Exploration: The visual design inherently promotes systematic thinking and prevents crucial areas from being overlooked. This structured approach is especially valuable for remote teams who may find it challenging to maintain focus and organization in virtual brainstorming sessions.
- In-Depth Analysis: The branching structure encourages deep diving into multiple aspects of a concept, making it ideal for complex problem-solving. This depth of analysis is crucial for remote tech teams working on intricate projects that demand thorough consideration of all variables.
- Balanced Approach: The Lotus Blossom Diagram strikes a balance between creative thinking and organized exploration. It allows for free-flowing idea generation within the structured framework of the diagram.
- Visual and Collaborative: The diagram can be easily created and shared digitally using collaborative whiteboarding tools like Miro or Mural, making it perfect for remote team brainstorming sessions.
Pros:
- Promotes thorough exploration from multiple perspectives.
- Structured format prevents overlooking critical aspects.
- Facilitates a balanced approach to creative and systematic thinking.
- Excellent for complex problem-solving requiring in-depth analysis.
Cons:
- More complex to set up than simpler brainstorming techniques.
- Can be overwhelming for basic or straightforward brainstorming needs.
- Requires a dedicated time commitment to complete fully.
- The structured nature may restrict truly free-form, spontaneous ideation.
Pricing and Technical Requirements:
The Lotus Blossom Diagram technique itself is free to use. However, you might choose to utilize digital whiteboarding tools like Miro or Mural (which have free and paid versions) to create and collaborate on the diagram remotely.
Comparison with Similar Tools:
While mind maps also offer a visual approach to brainstorming, they are less structured than the Lotus Blossom Diagram. Mind maps are better suited for free-flowing idea generation, whereas the Lotus Blossom Diagram excels at systematically exploring a complex concept in detail.
Implementation Tips for Remote Teams:
- Use a collaborative online whiteboard to create and share the diagram.
- Assign team members to specific petals or sub-topics to ensure balanced contribution.
- Time-box each stage of the brainstorming process to maintain focus and efficiency.
- Encourage active participation and open communication throughout the session.
Website: https://thinkersco.com/lotus-blossom-technique/
8. Circle Map
The Circle Map is a fantastic brainstorming graphic organizer, especially valuable for remote teams seeking a simple yet effective way to define concepts and gather initial thoughts. Its ease of use makes it a great starting point for any brainstorming session, regardless of the team's technical expertise. It allows everyone to contribute quickly and easily, which can be particularly helpful in a remote setting where fostering collaboration can be challenging.
At its core, the Circle Map consists of two concentric circles. The inner circle holds the main topic or concept you're brainstorming, while the outer circle is where you jot down related information, context, and ideas. This brainstorming graphic organizer encourages free association, allowing team members to contribute any type of information, from hard facts and examples to feelings and opinions. This flexibility makes it a versatile tool for remote startups, tech teams, and other distributed groups.
For remote tech teams, the Circle Map can be a valuable asset when kicking off a new project. It provides a quick way to define project scope, gather existing knowledge, and identify potential challenges. For example, if the team is developing a new feature, the inner circle could hold the feature name, while the outer circle could contain user needs, technical requirements, and potential roadblocks. Learn more about Circle Map for additional context and applications.
The simplicity of the Circle Map is one of its biggest strengths. No special software or technical skills are required; you can create one using a simple whiteboard tool, a shared document, or even pen and paper. This makes it accessible to all team members, regardless of their location or technical proficiency. This also means there are no associated costs, making it a free brainstorming graphic organizer option for budget-conscious remote startups.
Pros:
- Extremely easy to create and understand, ensuring everyone on the team can participate effectively.
- Non-threatening format that encourages participation, especially beneficial for remote teams where communication can sometimes feel impersonal.
- Helps activate prior knowledge and surface existing information before diving into deeper brainstorming.
- Flexible enough to accommodate various types of information, catering to different thinking styles within the team.
Cons:
- Limited structure for organizing complex relationships between ideas, which might be a drawback for more intricate projects.
- Doesn't visually represent hierarchies or categories of information, potentially making analysis more challenging.
- Can become visually cluttered if too much information is added, especially when working with larger remote teams.
- Might be too basic for advanced brainstorming needs requiring more structured methods.
You can find more information about Thinking Maps, including the Circle Map, on their website: https://www.thinkingmaps.com/why-thinking-maps-2/
The Circle Map deserves its place on this list as a foundational brainstorming graphic organizer. Its simplicity and accessibility make it a perfect starting point for remote teams looking to quickly define a concept, gather initial thoughts, and lay the groundwork for more focused brainstorming activities.
Brainstorming Organizer Comparison
| Tool Name | Core Features / Structure | User Experience / Ease of Use | Target Audience 👥 | Unique Selling Points ✨ | Value / Price 💰 |
|---|---|---|---|---|---|
| Mind Map | Radial branches, visual with colors & images | ★★★★☆ Visual, engaging but can clutter | Creative teams, visual thinkers | Encourages free association, flexible | Free to low cost 💰 |
| Concept Map | Labeled connections, cross-links, hierarchical | ★★★☆☆ Clear but complex to create | Analytical thinkers, educators | Shows complex relationships, cross-links | Free tools available 💰 |
| Fishbone Diagram | Cause-effect spine, categories (6M) | ★★★★☆ Structured, focused on problems | Quality/Process teams | Ideal for root cause analysis 🏆 | Free resources 💰 |
| Bubble Map | Central bubble with descriptive surrounding bubbles | ★★★★★ Simple, quick to create | Beginners, students | Excellent for descriptive brainstorming | Free/simple tools 💰 |
| SWOT Analysis Matrix | Four quadrants: Strengths, Weaknesses, etc. | ★★★★☆ Easy, strategic decision-making | Managers, planners | Balanced 360° analysis framework 🏆 | Free/basic tools 💰 |
| Ladder Diagram | Vertical sequence steps, logical flow | ★★★☆☆ Clear for processes but linear | Process-oriented teams | Visualizes process steps & sequences | Free/basic tools 💰 |
| Lotus Blossom Diagram | Central + 8 themes + 64 subtopics | ★★★☆☆ Deep, systematic but complex | Advanced problem solvers | Depth & breadth of exploration ✨ | Free/specialized tools 💰 |
| Circle Map | Two concentric circles, central + context info | ★★★★★ Very simple, beginner-friendly | Educators, introductory groups | Activates prior knowledge easily | Free/simple tools 💰 |
Boost Your Brainstorming with Bulby
From mind maps to lotus blossom diagrams, this article has explored eight powerful brainstorming graphic organizers that can transform your ideation process. Whether you're tackling a complex problem or simply seeking innovative solutions, these tools provide a visual framework for organizing your thoughts, fostering collaboration, and generating a wealth of ideas. Key takeaways include the importance of choosing the right organizer for your specific needs and ensuring everyone on the team understands how to use it effectively. For instance, a fishbone diagram is ideal for root cause analysis, while a SWOT analysis helps evaluate strengths, weaknesses, opportunities, and threats. While brainstorming graphic organizers can help you generate ideas, using a creative brief can provide structure and direction to your brainstorming sessions. A creative brief helps define the scope, goals, and target audience for your project, ensuring your brainstorming efforts are focused and productive. Explore some helpful creative brief templates to get started.
When selecting a tool, consider the complexity of your project, the size of your team, and the desired outcome. Implementing these tools effectively requires clear communication and active participation from all team members, especially in remote settings.
For remote teams, startups, and tech teams looking to streamline the brainstorming process, consider leveraging a dedicated platform. Bulby offers an intuitive, AI-powered environment perfect for remote collaboration. It helps structure your brainstorming sessions around the graphic organizers you choose and facilitates diverse thought, leading to more impactful outcomes.
Ready to supercharge your brainstorming sessions and unlock the full potential of your remote team? Bulby integrates seamlessly with various brainstorming graphic organizers, enabling you to visualize and organize your ideas effectively in a collaborative online space. Start exploring Bulby today and experience a new level of collaborative brainstorming.