
Beyond the Data: Turning Information into Impactful Action
In a world flooded with data, simply collecting information isn't enough. The real competitive advantage lies in transforming raw data into actionable insights—specific, evidence-based conclusions that direct clear, impactful decisions. These insights bridge the gap between knowing what happened and understanding exactly what to do next. An actionable insight doesn't just present a problem; it illuminates the path to a solution.
This article moves beyond theory to provide concrete, actionable insights examples from leading companies. We will break down how organizations analyze customer behavior, market trends, and operational data to create strategies that deliver measurable results. You will learn how to identify patterns and translate them into specific actions that drive growth, improve efficiency, and enhance customer satisfaction.
Many of these strategies involve streamlining operations once an insight is uncovered. For more specific instances of how insights translate into operational improvements, explore top business process automation examples.
Get ready to see precisely how teams turn complex datasets into strategic advantages. We will dissect seven powerful examples, revealing the methods you can replicate to generate insights that truly move the needle for your team or business.
1. Customer Churn Prediction and Prevention
Customer churn prediction is a powerful strategy where businesses use data to identify customers who are likely to stop using their service. Instead of reacting after a customer has already left, this approach allows teams to be proactive. By analyzing behavioral data, engagement metrics, and past transactions, companies can calculate a "churn risk" score for each user, turning predictive analytics into one of the most valuable actionable insights examples a business can have.
This insight is crucial because retaining an existing customer is almost always more cost-effective than acquiring a new one. When you know who might leave and why, you can implement targeted interventions to improve their experience and demonstrate value, effectively reducing customer attrition and protecting revenue streams.
Strategic Analysis and Application
At its core, churn prediction is about pattern recognition. For a subscription service like Netflix, a key indicator might be a user's declining viewing hours or a long period of inactivity. For a SaaS company, it could be a drop in feature usage or a lack of logins from key team members.
The goal is to move from raw data to a clear, actionable signal. For example, a telecommunications company like Verizon doesn't just look at a single dropped call. It combines call data, billing inquiries, plan changes, and competitor offer searches in their area to build a comprehensive risk profile. This detailed analysis allows them to create precise, targeted retention campaigns instead of generic, "please don't leave" emails.
The following infographic illustrates the high-level process flow for turning data into a retention action.
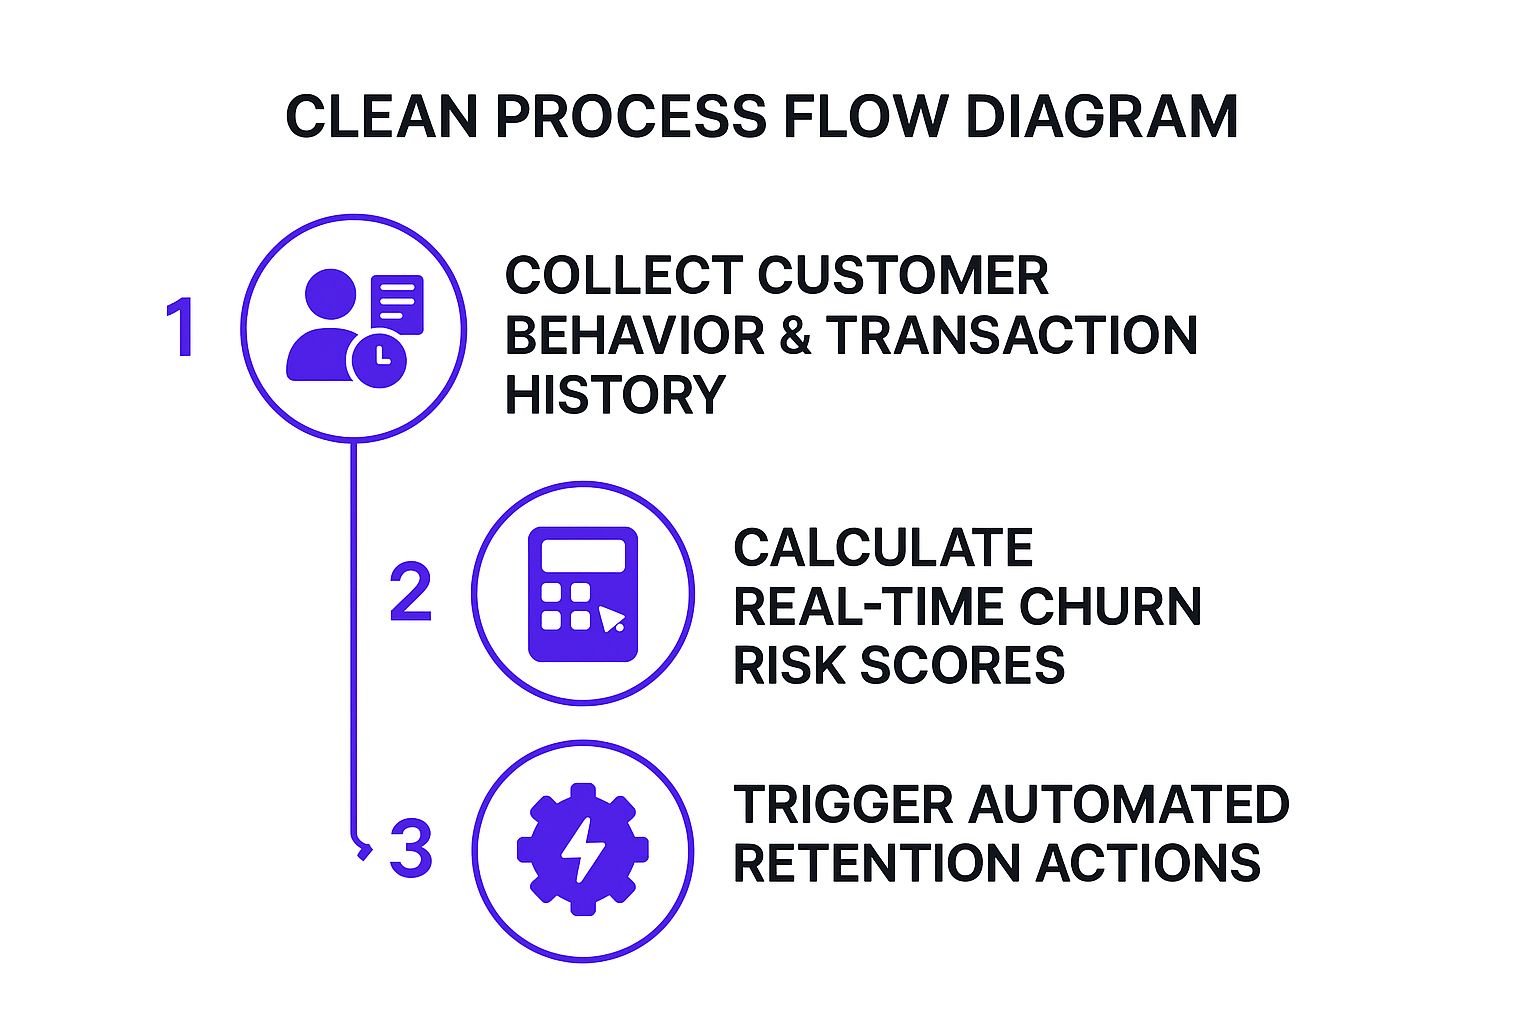
This streamlined process shows how to operationalize the insight, moving systematically from data collection to automated, personalized customer retention efforts.
Actionable Takeaways
- Start with Simple Metrics: You don't need a complex AI model from day one. Begin by tracking basic indicators like login frequency, purchase recency, or last contact date.
- Automate Your Interventions: Create automated workflows. For instance, if a user's engagement score drops below a certain threshold, trigger an automated email with a helpful guide, a special offer, or a request for feedback.
- Combine Quantitative and Qualitative Data: Numbers tell you what is happening, but customer feedback tells you why. Use surveys or direct outreach for high-risk accounts to understand the root cause of their dissatisfaction. If you need help framing these issues, you can learn more about defining clear problem statements for your business.
2. Inventory Optimization Through Demand Forecasting
Inventory optimization is a data-driven strategy where businesses use advanced analytics to predict future product demand with high accuracy. Instead of relying on gut feelings or simplistic historical averages, this approach combines sales data, seasonality, market trends, and even external factors like weather to ensure the right amount of product is in the right place at the right time. This turns complex forecasting models into one of the most powerful actionable insights examples for any company managing physical goods.
This insight is critical for balancing the costs of overstocking (storage fees, waste, markdowns) against the costs of understocking (lost sales, poor customer experience). When you know what customers will want and when, you can make precise purchasing and distribution decisions, maximizing sales while minimizing holding costs and waste.

Strategic Analysis and Application
At its core, demand forecasting is about identifying signals that predict future buying behavior. For a retailer like Walmart, this goes beyond simple sales history. The company famously analyzes weather data to increase stock of items like batteries and strawberry Pop-Tarts ahead of a hurricane warning, anticipating specific customer needs in a crisis.
The goal is to move from broad predictions to specific, actionable inventory commands. For example, the fast-fashion giant Zara uses real-time sales data from its stores to inform production decisions. If a particular style of jacket is selling out in Milan, that data is fed back to its central manufacturing hub, and a new batch can be designed, produced, and shipped to stores worldwide in just a few weeks. This agile model, powered by real-time data, allows Zara to respond to micro-trends instantly, avoiding the pitfall of producing clothes that nobody wants.
This level of detail enables a business to create a highly responsive and efficient supply chain, directly translating predictive insights into tangible financial gains and a superior customer experience.
Actionable Takeaways
- Integrate External Factors: Don't limit your analysis to internal sales data. Incorporate external variables like upcoming holidays, local events, economic indicators, or even weather forecasts to create a more robust prediction model.
- Start with High-Impact Products: Begin your forecasting efforts on your "A-list" items, those with high sales volume or high value. Perfecting the process here will deliver the greatest initial return on investment before you expand to your entire catalog.
- Regularly Validate Your Forecasts: A forecast is a living hypothesis. Continuously compare your predictions against actual sales outcomes to identify inaccuracies and refine your model over time. This feedback loop is essential for improving accuracy.
- Maintain a Safety Stock: No forecast is perfect. For your most critical items, build in a calculated safety stock to buffer against unexpected demand spikes or supply chain disruptions, ensuring you never disappoint your most loyal customers.
3. A/B Testing for Conversion Rate Optimization
A/B testing is a systematic method of comparing two or more versions of a digital asset, like a webpage, email, or app feature, to determine which one performs better. By presenting different versions to users at random and measuring the results, businesses can make data-driven decisions instead of relying on guesswork. This process transforms raw user behavior data into one of the most direct and impactful actionable insights examples available, leading to measurable improvements in conversion rates.

The power of A/B testing lies in its simplicity and clarity. It isolates variables to show a clear cause-and-effect relationship between a change and user behavior. When you know that changing a button color from green to orange increases sign-ups by 15%, you have a concrete, replicable insight that directly contributes to business goals. This approach removes subjectivity and empowers teams to incrementally optimize their user experience for maximum effect.
Strategic Analysis and Application
At its core, A/b testing is about scientific experimentation applied to business. For an e-commerce site like Booking.com, this might mean testing different property photos, promotional messaging, or even the layout of the booking form to reduce friction and increase reservations. For a political campaign, as seen with Obama's 2008 run, it meant testing different website headlines and media, which famously resulted in a 40% increase in email signups and millions in additional donations.
The key is to move from a general hypothesis to a specific, testable question. For example, instead of asking, "How can we get more signups?" an A/B test asks, "Does changing our call-to-action from 'Sign Up' to 'Get Started for Free' increase our signup rate?" This granular focus, popularized by growth teams at Google and Netflix, ensures that every insight is precise and directly informs design and content decisions. Google's famous test of 41 shades of blue for ad links reportedly generated an extra $200 million in annual revenue, proving that even minor tweaks can have massive financial implications.
The video below explains how these experiments work in practice.
This methodical approach turns marketing and product design from an art into a science, where decisions are backed by hard data.
Actionable Takeaways
- Test One Variable at a Time: To get clear results, only change one element between Version A and Version B. If you change both the headline and the button color, you won’t know which change was responsible for the outcome.
- Focus on High-Impact Areas: Start by testing elements that have the biggest potential influence on conversions, such as headlines, call-to-action (CTA) buttons, forms, and key landing page images.
- Ensure Statistical Significance: Run your test long enough to gather sufficient data and account for user behavior variations, like weekday versus weekend traffic. Don't end a test prematurely based on early results.
- Document Everything: Keep a log of all tests, including your hypothesis, the variations, the results, and what you learned. This creates a valuable knowledge base to inform future experiments and helps you understand your audience better. If you need inspiration, you can explore various brainstorming process steps to generate new testing ideas.
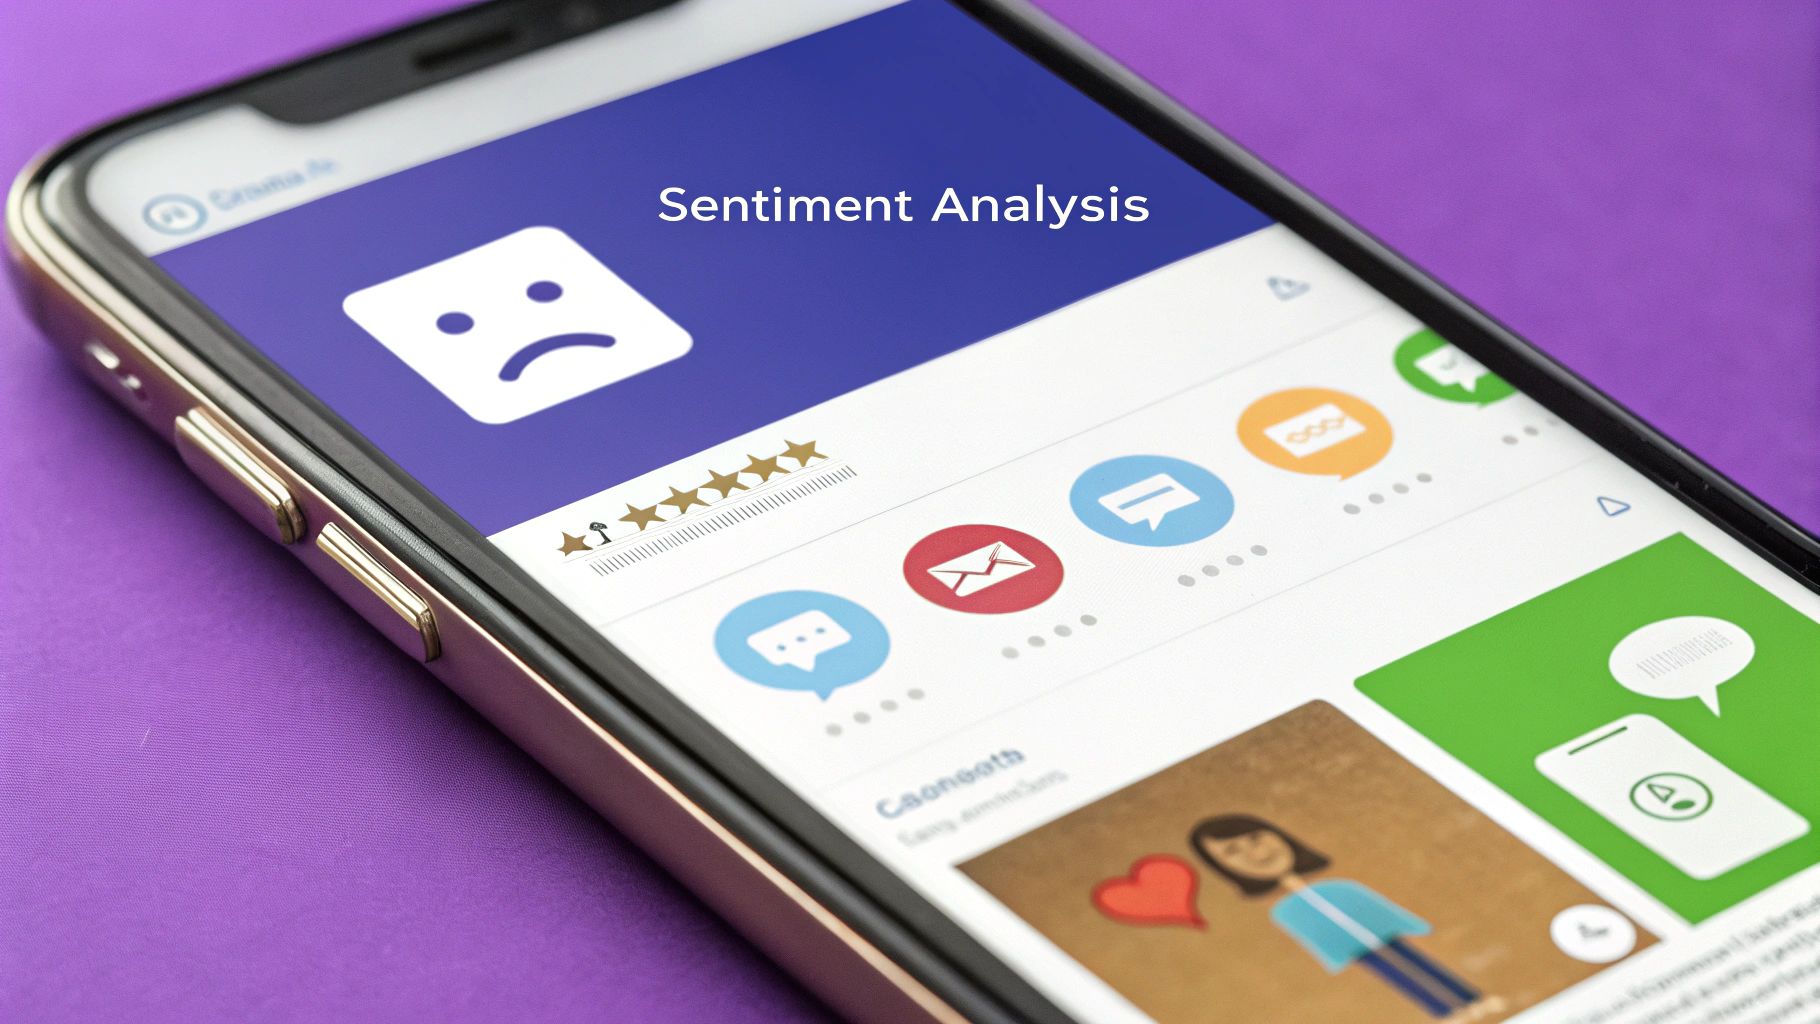
4. Social Media Sentiment Analysis for Brand Management
Social media sentiment analysis is a powerful application of natural language processing (NLP) where businesses analyze online conversations to understand public opinion. By monitoring mentions, comments, and posts across platforms like Twitter, Facebook, and Instagram, companies can gauge the emotional tone, positive, negative, or neutral, associated with their brand, products, or campaigns. This process transforms vast amounts of unstructured social data into one of the most immediate and responsive actionable insights examples available to a modern marketing team.
This insight is critical for proactive brand management. Instead of waiting for quarterly reports or formal surveys, teams can get a real-time pulse on customer perception. Knowing how the public feels allows for rapid crisis intervention, validation of marketing messages, and identification of emerging trends or product issues, enabling brands to protect their reputation and strengthen customer relationships.
Strategic Analysis and Application
At its core, sentiment analysis is about contextual understanding. An algorithm doesn't just count keywords; it interprets the intent behind the language. For instance, a brand like Delta Airlines uses this to instantly flag negative tweets about flight delays or lost luggage, routing them to customer service for a swift response that can turn a poor experience into a positive one. This goes far beyond simple brand monitoring.
The goal is to move from passive listening to active strategy. For example, during a major campaign launch, Coca-Cola can monitor sentiment in real time to see if its messaging is resonating positively with its target audience. If a particular ad spot receives unexpected negative feedback in one region, the marketing team can quickly adjust its media buy or messaging to correct the course before significant brand damage occurs. Similarly, McDonald's tracked public sentiment when testing new menu items to guide its national rollout strategy, prioritizing items that generated the most organic excitement.
Actionable Takeaways
- Set Up Real-Time Alerts: Configure your analytics tools to send immediate notifications for sharp spikes in negative sentiment or mentions from influential accounts. This enables rapid crisis response.
- Combine Automated Analysis with Human Oversight: AI is excellent for processing volume, but human analysts are needed to interpret sarcasm, irony, and cultural context that algorithms might miss.
- Segment Your Sentiment Data: Don't just look at the overall brand sentiment. Break it down by product, geographic region, or customer demographic to uncover more granular insights that can inform targeted marketing or product development efforts.
5. Predictive Maintenance in Manufacturing
Predictive maintenance is a revolutionary industrial strategy where manufacturers use data from IoT sensors and machine learning algorithms to forecast equipment failures before they happen. Instead of adhering to a rigid, time-based maintenance schedule or reacting to costly breakdowns, this approach allows maintenance teams to intervene at the precise moment it is needed. By analyzing real-time performance data like vibration, temperature, and output, companies can turn complex operational metrics into one of the most impactful actionable insights examples available.
This insight is fundamentally transformative because it shifts maintenance from a cost center to a strategic, value-driving function. Unplanned downtime is one of the biggest hidden costs in manufacturing. Knowing exactly which machine is likely to fail and when allows businesses to schedule repairs efficiently, optimize spare parts inventory, and avoid catastrophic production stoppages, directly protecting operational continuity and profitability.
Strategic Analysis and Application
At its core, predictive maintenance is about detecting subtle anomalies that signal impending failure. For a company like Rolls-Royce, which monitors its aircraft engines globally, this means analyzing thousands of data points mid-flight to identify performance deviations that could indicate a future issue. Similarly, Tesla’s electric vehicles continuously transmit performance data, allowing the company to predict part degradation and proactively schedule service appointments for owners.
The goal is to move from raw sensor readings to a specific, high-confidence maintenance trigger. A manufacturing plant doesn't just act on a single temperature spike. It correlates that spike with vibration patterns, energy consumption, and historical failure data to build a robust predictive model. This detailed analysis enables them to replace a specific bearing just before it seizes, rather than overhauling the entire machine on a guess. For a deeper dive into how AI transforms industrial operations, explore detailed examples of AI-driven predictive maintenance.
Actionable Takeaways
- Start with Critical Assets: Don't try to monitor every piece of equipment at once. Begin with the most critical, high-cost machinery where unplanned downtime would cause the most significant disruption.
- Establish a Performance Baseline: Before you can predict anomalies, you must understand normal operation. Collect data for a set period to establish a clear baseline of performance metrics for your key equipment.
- Train Your Maintenance Teams: Predictive maintenance requires a new skillset. Invest in training your staff to understand the data, trust the predictive alerts, and integrate these insights into their daily workflows.
- Integrate with Existing Systems: To maximize efficiency, feed predictive alerts directly into your existing Computerized Maintenance Management System (CMMS) to automate work order creation and resource scheduling.
6. Dynamic Pricing Based on Market Conditions
Dynamic pricing is a strategy where algorithms automatically adjust product or service prices in real-time based on fluctuating market signals. Instead of setting static prices, this approach allows businesses to be agile and responsive. By analyzing demand, competitor pricing, inventory levels, and even weather patterns, companies can turn live market data into immediate pricing decisions, making this one of the most profitable actionable insights examples available.
This insight is powerful because it enables businesses to maximize revenue and maintain a competitive edge simultaneously. When you know the optimal price for a specific moment, you can capture more value during peak demand and attract budget-conscious customers during lulls, ensuring you never leave money on the table or price yourself out of the market.
Strategic Analysis and Application
At its core, dynamic pricing is about matching price to perceived value at any given moment. For an airline, the key indicators are booking velocity, remaining seat inventory, and time until departure. A flight with few seats left a week before departure will be priced much higher than one that is half-empty months in advance.
The goal is to move from broad market data to a precise, automated pricing action. For instance, Amazon's system doesn't just look at one competitor's price. It analyzes millions of data points, including competitor stock levels, shipping times, and customer demand trends, to reprice items frequently throughout the day. Similarly, Uber's surge pricing directly links ride costs to the real-time ratio of rider demand versus driver availability in a specific geographic area, transparently reflecting market conditions to balance supply and demand.
Actionable Takeaways
- Set Clear Boundaries: Establish price floors and ceilings to prevent extreme price fluctuations that could confuse or alienate customers. These guardrails ensure your pricing remains logical and brand-aligned.
- Segment and Test: Before a full rollout, test your pricing algorithms on smaller customer segments or specific product lines. This allows you to measure impact and refine your strategy without significant risk.
- Monitor Competitor Reactions: Your price changes will likely trigger a response from competitors. Continuously monitor their adjustments and adapt your strategy accordingly. This requires strong team alignment, which can be improved with the right collaborative decision-making tools.
- Communicate Value: When prices increase due to high demand, clearly communicate the value customers are receiving. For example, Uber explains that surge pricing helps make more drivers available, justifying the higher cost by ensuring service availability.
7. Customer Lifetime Value (CLV) Segmentation
Customer Lifetime Value (CLV) segmentation goes beyond tracking single purchases to predict the total net profit a business can expect from a customer over their entire relationship. By calculating and grouping customers based on their projected value, companies can make strategic decisions about where to invest their marketing budget, retention efforts, and service resources. This turns a broad customer base into a prioritized portfolio, making it one of the most powerful actionable insights examples for sustainable growth.
This insight is transformative because it shifts focus from short-term revenue to long-term relationship building. Knowing which customers are most valuable allows you to tailor experiences, rewards, and communication to nurture those relationships, ensuring maximum return on investment and fostering deep loyalty.
Strategic Analysis and Application
At its heart, CLV segmentation is about resource allocation. It answers the fundamental question: "Which customers deserve our best efforts?" For a brand like Starbucks, this means identifying high-CLV customers who not only buy coffee frequently but also purchase high-margin food items. These are the customers who receive the most compelling personalized offers through the Starbucks Rewards app.
The goal is to move beyond one-size-fits-all marketing. For example, American Express analyzes transaction volume, credit history, and product usage to segment card members. High-CLV members are offered premium services, higher credit limits, and exclusive access to events, while emerging segments might receive educational content to encourage greater card usage. This targeted approach maximizes profitability by aligning investment with customer potential. To deepen your understanding of how valuable customer insights translate into action, explore practical customer segmentation examples and see how different businesses apply these strategies.
Actionable Takeaways
- Integrate Behavioral and Monetary Data: A true CLV model includes more than just purchase history. Factor in engagement metrics like app usage, email opens, and customer service interactions to build a more accurate picture of a customer's long-term value.
- Create Tiered Service Levels: Don't treat every customer the same. Establish different service tiers based on CLV segments. Your most valuable customers could get a dedicated account manager or priority support, while lower-value segments might be served through automated channels.
- Update Your Models Regularly: Customer behavior changes. Refresh your CLV calculations quarterly or semi-annually with new data to ensure your segments remain accurate and your strategies stay relevant.
7 Actionable Insights Examples Comparison
| Insight Title | Implementation Complexity 🔄 | Resource Requirements ⚡ | Expected Outcomes 📊 | Ideal Use Cases 💡 | Key Advantages ⭐ |
|---|---|---|---|---|---|
| Customer Churn Prediction and Prevention | Moderate to high: needs continuous model updates | High: requires substantial historical customer data, CRM integration | Reduces churn by 15-25%, increases lifetime value | Subscription services, telecom, streaming platforms | Proactive retention, measurable ROI, reduces acquisition cost |
| Inventory Optimization Through Demand Forecasting | High: complex models, multi-system integration | High: requires extensive data sources and system integration | Cuts holding costs by 10-30%, minimizes stockouts | Retail, manufacturing, supply chain | Cost savings, improved cash flow, supply chain risk assessment |
| A/B Testing for Conversion Rate Optimization | Moderate: needs statistical setup and traffic volume | Moderate: requires testing platforms and sufficient user traffic | Data-driven improvements, measurable conversion uplift | Websites, apps, marketing campaigns | Minimizes risk, continuous improvement, actionable insights |
| Social Media Sentiment Analysis for Brand Management | Moderate: NLP models and real-time monitoring | Moderate: tools for social listening and human verification | Rapid crisis response, trend spotting | Brand management, marketing, customer experience | Real-time feedback, campaign effectiveness, competitor insights |
| Predictive Maintenance in Manufacturing | High: IoT sensor deployment and technical expertise | High: investment in sensors, data systems, and training | Reduces downtime by 50%, extends equipment life | Manufacturing, transportation, energy sectors | Cost optimization, safety, extended asset lifespan |
| Dynamic Pricing Based on Market Conditions | High: requires sophisticated algorithms and real-time data | High: advanced infrastructure and analytics platforms | Maximizes revenue and profit margins | E-commerce, ride-sharing, airlines | Revenue maximization, responsiveness, inventory turnover |
| Customer Lifetime Value (CLV) Segmentation | Moderate to high: predictive modeling and segmentation | High: extensive customer data and analytics resources | Optimizes marketing spend and retention strategies | Retail, finance, subscription-based businesses | Improved ROI, targeted marketing, product and service optimization |
From Insight to Innovation: Your Next Steps
We've journeyed through a diverse landscape of powerful, actionable insights examples, from predicting customer churn to optimizing supply chains with demand forecasting. Each case study, whether it was refining website conversions through A/B testing or managing brand reputation via social sentiment analysis, underscores a single, transformative truth: data is only as valuable as the action it inspires. The true power lies not in the raw numbers, but in the strategic decisions they enable.
The examples we explored reveal a consistent pattern. Success isn't about having the biggest dataset; it's about building a robust process to translate that data into decisions. From dynamic pricing models that respond to real-time market shifts to CLV segmentation that personalizes customer engagement, the most innovative companies have mastered the art of moving from analysis to implementation. They have cultivated a culture where curiosity is encouraged, and data-driven action is the standard.
Key Takeaways: The Path from Data to Impact
Reflecting on these actionable insights examples, several core principles emerge as essential for any team, especially remote and distributed ones, aiming to replicate this success.
- Specificity is Your Superpower: Vague observations lead to vague actions. The best insights are highly specific. Instead of "customers are unhappy," a powerful insight is "customers in the 18-24 demographic who signed up in Q3 are churning at a 30% higher rate due to a confusing onboarding workflow." This level of detail points directly to a solvable problem.
- Connect Insights to Business Goals: An insight is only actionable if it aligns with a key performance indicator (KPI). Predictive maintenance insights directly reduce operational costs and downtime. A/B testing insights directly increase conversion rates and revenue. Always ask: "How does acting on this finding help us achieve our primary objectives?"
- Empower Your Team with the Right Tools: The journey from data to action can be stalled by logistical friction, cognitive biases, or a simple lack of structured process. This is particularly challenging for remote teams where spontaneous collaboration is less frequent. Providing frameworks and tools for structured thinking is not just a luxury; it's a necessity.
Your Action Plan for Generating Insights
So, where do you go from here? The first step is to foster an environment where your team feels empowered to dig into the data and surface these critical findings. You don't need a massive data science department to start.
- Start with a Question: Begin with a clear business problem you want to solve. Are you trying to reduce churn, increase sales, or improve customer satisfaction?
- Gather Relevant Data: Collect the necessary information. This could be from your CRM, website analytics, customer surveys, or social media listening tools.
- Analyze and Ideate: Look for patterns, trends, and anomalies. This is the crucial step where raw data transforms into potential insights.
- Translate to Action: Formulate a clear, testable hypothesis and define a specific action. "If we simplify the checkout process by removing two fields, we predict a 5% increase in completed purchases."
Mastering this cycle is what separates industry leaders from the rest. It's about building a repeatable system for innovation, turning your team's analytical work into a reliable engine for growth and strategic advantage. The actionable insights examples in this article prove that with the right approach, any organization can unlock this potential.
Are you ready to bridge the gap between analyzing data and creating breakthrough solutions? Bulby provides AI-powered frameworks and research-backed exercises designed to help your team overcome creative blocks and turn valuable insights into tangible, innovative outcomes. Start your journey from insight to impact today by exploring Bulby.