
Unleash Your Team's Creative Power
Struggling with unproductive brainstorms? Remote teams often face collaboration challenges when generating new ideas. A brainstorm graphic organizer can transform your sessions. This listicle presents seven powerful brainstorm graphic organizer techniques to unlock your team's potential: Mind Maps, Concept Maps, Web Diagrams (Spider Maps), Fishbone Diagrams (Ishikawa), Bubble Maps, Tree Diagrams, and Lotus Diagrams. These visual tools provide structure and focus, ensuring every team member contributes effectively. Learn how these techniques can boost your remote team's collaboration and innovation.
1. Mind Map
Mind maps are highly effective brainstorm graphic organizers, perfect for remote teams looking to generate ideas collaboratively. They are radial diagrams that visually represent the connections between different pieces of information. Starting with a central idea in the middle, related concepts branch outward, creating a visual hierarchy of information. This format allows for non-linear thinking, which is crucial for brainstorming, and makes it easier to see the relationships between ideas during brainstorming sessions. This makes mind maps a powerful tool for remote tech teams and startups who need to innovate and problem-solve effectively from different locations.
This infographic visualizes the key elements of a mind map, showcasing the central topic, branching concepts, keywords, and visual elements. The central concept, "Mind Map," is the core, radiating out to essential features like "Visual Hierarchy," "Non-Linear Thinking," and "Concept Association." These features further connect to related advantages, such as "Engaging," "Creative," and "Organized," demonstrating the benefits of using this brainstorming technique. The infographic also visually links mind maps to their practical applications like brainstorming, note-taking, and project planning, highlighting the versatility of this tool. The visualization reinforces the core value proposition of mind maps: fostering creative thinking and structured organization for effective brainstorming.
Mind maps deserve a top spot in any list of brainstorm graphic organizers because they are visually engaging, easy to use, and promote free-flowing thought. Key features include a central main topic, radiating branches forming a hierarchical structure, the use of colors, images, and keywords for better retention, flexible organization, and a clear visual representation of the relationships between concepts. These features combine to make mind mapping a powerful brainstorming tool for remote teams.
When and Why to Use a Mind Map:
Mind maps are particularly useful when:
- Brainstorming new ideas: The radial structure encourages exploration of multiple avenues.
- Planning complex projects: Breaking down a project into smaller, interconnected tasks becomes easier.
- Problem-solving: Visualizing different facets of a problem can lead to innovative solutions.
- Note-taking: Especially effective for capturing and connecting key points from meetings or lectures. This is valuable for remote teams working across different time zones who need to efficiently share meeting notes.
- Strategic planning: Mapping out company goals, strategies, and action items.
Examples of Successful Implementation:
- Software development teams use mind maps to brainstorm new features and map out user journeys.
- Marketing teams employ mind maps to plan campaign concepts and visualize the connections between different marketing channels.
- Startups utilize mind maps to develop business plans and explore potential market opportunities.
- Remote teams use mind maps for collaborative brainstorming sessions, ensuring everyone can contribute and see the big picture.
Pros:
- Encourages creative thinking and the association of ideas.
- Easy to add new information without restructuring the entire map.
- Helps visualize complex relationships.
- Engages both logical and creative sides of the brain.
- Effective for visual learners.
Cons:
- Can become cluttered if too many ideas are added without proper organization.
- May be difficult to prioritize information.
- Not always suitable for linear processes or sequential thinking.
- Can be challenging to share in digital formats if hand-drawn, though numerous mind mapping software solutions mitigate this.
Tips for Creating Effective Mind Maps:
- Start with a central image: Representing your main topic with a visual cue strengthens memory and focus.
- Use curved lines rather than straight ones: Curved lines are more visually appealing and encourage more free-flowing thought.
- Employ different colors for different branches: Color-coding helps distinguish themes and categories.
- Use single keywords rather than phrases: Keywords are easier to remember and promote quicker thinking.
- Add visual elements like icons or images: Visuals enhance memory retention and engagement.
Popularized By:
Tony Buzan (credited with inventing the modern mind map), MindMeister, XMind, MindNode. These tools are particularly valuable for remote teams, offering collaborative features and cloud storage.
Using mind maps as a brainstorm graphic organizer can greatly benefit remote teams, tech teams, and startups by fostering creativity, improving communication, and facilitating better organization. The visual nature of mind maps bridges the gap of physical distance, allowing distributed team members to connect and contribute effectively.
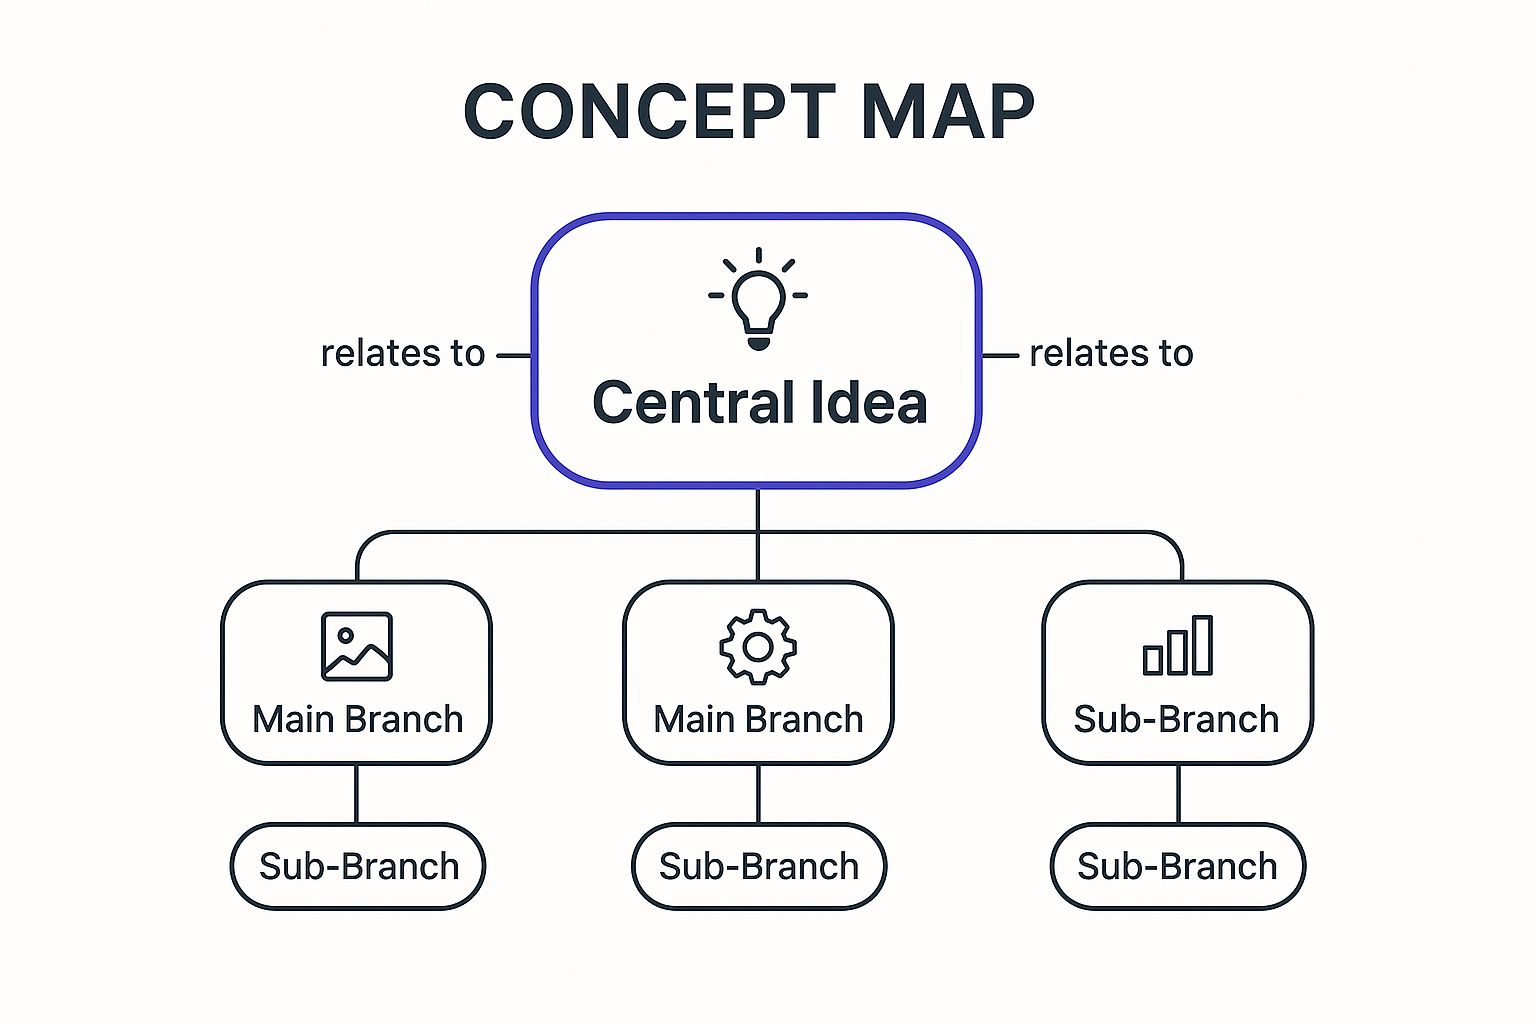
2. Concept Map
A concept map is a powerful brainstorm graphic organizer perfect for remote teams, especially those in tech or startup environments, tackling complex projects. It goes beyond simple idea generation by visually representing the relationships between those ideas. This method allows for a deeper, more structured exploration of a topic than other brainstorming tools, making it ideal for distributed teams who need to align their understanding of intricate systems or problems.
Essentially, a concept map is a network of interconnected concepts. Each concept, represented by a box or circle, is linked to others with lines labeled with descriptive words that define the relationship. Unlike a mind map, which radiates outward from a central idea, a concept map allows for cross-linking between any two concepts, regardless of their hierarchical position. This feature makes it exceptionally useful for exploring non-linear relationships and fostering systems thinking.
How it Works:
The fundamental building blocks of a concept map are:
- Concepts: Represented as nodes (boxes or circles) containing a single word or short phrase.
- Linking Words: These words, placed on the connecting lines, articulate the relationship between two concepts, forming meaningful propositions. For example, "causes," "leads to," "inhibits," or "requires."
- Cross-Links: Connections between concepts that might not be directly related hierarchically, revealing hidden relationships and promoting a more holistic understanding.
- Hierarchical Structure: While allowing for cross-links, concept maps often still maintain a general hierarchical structure, with broader, more general concepts at the top, flowing down to more specific ones.
Why Concept Maps Deserve a Place in Your Brainstorming Toolkit:
Concept mapping offers several key benefits for remote teams:
Pros:
- Excellent for Showing Complex Relationships: This is where concept maps truly shine. They excel at illustrating intricate connections between ideas, fostering a shared understanding amongst team members, especially vital for remote tech teams working on complex systems.
- Identifies Misconceptions and Gaps: The process of creating a concept map often reveals gaps in knowledge or differing interpretations of key concepts, allowing teams to address them early on.
- Creates Meaningful Propositions: Linking words force teams to define the relationships between concepts precisely, moving beyond simple association to create clear, actionable statements.
- Supports Systems Thinking and Complex Problem Solving: Concept maps encourage a holistic view of the problem space, crucial for remote startups developing innovative solutions.
- More Structured than Mind Maps: While mind maps are great for initial brainstorming, concept maps provide the structure needed for deeper analysis, particularly beneficial for technical subjects.
Cons:
- More Time-Consuming: Building a detailed concept map requires more time and effort than simpler brainstorming techniques.
- Learning Curve: Constructing effective concept maps requires some practice to master the principles of clear linking words and hierarchical structuring.
- Can Become Visually Complex: For very intricate topics, concept maps can become visually overwhelming.
- Less Spontaneous: The structured nature of concept mapping can sometimes hinder the free flow of ideas that characterize other brainstorming methods.
Examples of Successful Implementation:
- Remote Tech Teams: Mapping out the architecture of a new software system, defining API interactions, or visualizing data flows.
- Remote Startups: Developing a business model canvas, exploring competitive landscapes, or outlining a product roadmap.
- Educational Settings (relevant for remote training): Curriculum mapping or outlining complex technical concepts for training purposes.
Actionable Tips for Remote Teams:
- Start with a Focus Question: Clearly define the problem or topic you want to explore. This provides a guiding framework for your concept map.
- Identify Key Concepts First: Brainstorm a list of key concepts related to your focus question.
- Arrange from General to Specific: Organize the concepts hierarchically, placing broader concepts at the top and more specific ones below.
- Use Precise Linking Words: Choose linking words carefully to create meaningful propositions that accurately reflect the relationships between concepts.
- Review and Revise: Concept maps are iterative. Regularly review and revise your map as your understanding evolves.
- Consider Using Software: For complex maps, software like CmapTools (developed by the Institute for Human and Machine Cognition (IHMC), and popularized by Joseph Novak) can be invaluable for facilitating collaboration and allowing easy revision amongst distributed teams.
By leveraging the power of concept mapping, remote teams can collaboratively explore complex ideas, clarify relationships, and develop a shared understanding essential for successful project execution. This brainstorm graphic organizer offers a structured approach that bridges the distance between team members, facilitating deeper analysis and more effective problem-solving.
3. Web Diagram (Spider Map)
The Web Diagram, also known as a Spider Map, earns its place on this list of brainstorm graphic organizers for its sheer simplicity and speed. It’s a highly effective tool for quickly generating ideas and identifying potential categories related to a central theme, making it ideal for remote teams, tech teams, and startups looking for a fast brainstorming method. This visual tool places your central concept or topic in the middle, with related ideas branching out like a spider's web. This radial structure, while less structured than a mind map, provides a clear visual overview of connected thoughts.
How It Works:
At the heart of the web diagram is the core concept you're brainstorming about. From this central idea, simple lines radiate outwards, each leading to a related idea or subtopic. Unlike more hierarchical organizers, the web diagram primarily uses single-level connections, avoiding extensive branching. This simplicity makes it quick to create and easy to understand.
Features and Benefits:
- Centralized Focus: The central placement of the main topic keeps the focus clear and allows for a quick overview of all related ideas.
- Easy Categorization: As you connect ideas to the central topic, natural categories often emerge, helping organize your thoughts organically.
- Rapid Ideation: Its simple structure allows for rapid brainstorming, perfect for time-constrained remote teams.
- Accessibility: The web diagram is easy to understand and use, even for those unfamiliar with brainstorming techniques. This makes it a valuable tool for diverse remote teams.
Pros and Cons:
Pros:
- Extremely easy to create and requires minimal instruction.
- Perfect for rapid brainstorming sessions, particularly for remote teams working across different time zones.
- Accessible for all team members, regardless of their brainstorming experience.
- Facilitates natural categorization of information.
- Less intimidating than more complex graphic organizers.
Cons:
- Limited in its ability to depict complex relationships between ideas.
- Not suitable for hierarchical information or in-depth analysis.
- Can become cluttered if too many ideas are generated, which can happen quickly in active brainstorming sessions.
- Less effective for deep analysis compared to other formats.
Examples of Successful Implementation:
- Remote Tech Team Problem-Solving: A remote tech team can use a web diagram to quickly brainstorm potential solutions for a software bug, identifying different approaches to troubleshooting and fixing the issue.
- Remote Startup Product Development: A remote startup team can utilize a web diagram to brainstorm new product features, exploring various functionalities and user needs.
- Remote Team Project Planning: During a remote project kickoff meeting, a web diagram can be used to generate initial project ideas, identify key tasks, and explore potential challenges.
Actionable Tips for Using a Web Diagram:
- Start with the Core: Write the main topic clearly in a circle at the center of your page or digital whiteboard.
- Radiate Outwards: Draw lines outwards from the central circle and write related ideas at the end of each line.
- Color-Code Categories: Use different colors to represent different categories that emerge during the brainstorming process. This helps visualize potential groupings of ideas.
- Keep it Simple: Remember the purpose of the web diagram is initial idea generation, not in-depth analysis. Avoid overcomplicating the diagram.
- Use as a Springboard: Consider using the web diagram as a precursor to more structured organizing tools, such as mind maps or flowcharts, for deeper analysis.
Learn more about Web Diagram (Spider Map)
This brainstorming graphic organizer is a valuable tool for remote teams who need a quick and easy way to generate ideas and explore different perspectives. Its simplicity and visual nature make it an excellent starting point for any brainstorming session.
4. Fishbone Diagram (Ishikawa)
The Fishbone Diagram, also known as the Ishikawa or Cause-and-Effect Diagram, is a powerful brainstorm graphic organizer perfect for drilling down to the root cause of a problem. It visually resembles a fish skeleton, with the problem statement at the "head" of the fish, and the potential causes branching out along the "bones." This structure helps teams systematically explore all possible contributing factors, making it an excellent tool for remote teams, tech teams, and startups who need to collaborate effectively on problem-solving, even from a distance. This method excels at categorizing causes, enabling teams to distinguish between surface-level symptoms and underlying issues.

The "bones" of the fish represent categories of potential causes. Typically, 4-6 standard categories are used, such as People, Process, Equipment, Materials, Environment, and Management. These main categories form the "primary bones." Branching off from these are the "secondary bones," which represent specific causes within each category. For example, under the "People" category, specific causes might include "lack of training" or "miscommunication." This structured approach to cause analysis encourages thoroughness and helps prevent overlooking potential contributing factors.
This brainstorm graphic organizer earns its place on this list due to its targeted approach to problem analysis. While other brainstorming methods may be better suited for generating creative ideas, the Fishbone Diagram specifically excels at identifying the why behind a problem. This focused approach makes it a highly effective tool for remote teams who need to efficiently diagnose and resolve issues without extensive back-and-forth.
Examples of Successful Implementation:
- Manufacturing companies: Identifying the root causes of defects in a production line.
- Healthcare teams: Analyzing patient safety incidents to prevent future occurrences.
- Software development teams: Troubleshooting bugs and identifying areas for code improvement.
- Service organizations: Exploring the factors contributing to customer satisfaction issues.
- Remote startups: Diagnosing communication breakdowns or workflow inefficiencies.
Actionable Tips for Remote Teams:
- Clearly define the problem: Before starting, ensure everyone on the team has a shared understanding of the problem being addressed.
- Customize categories: Use the standard categories as a starting point, but adapt them to fit the specific context of your problem.
- "5 Whys": Encourage the team to ask "Why?" repeatedly for each identified cause to uncover deeper root causes. This technique is particularly effective in remote collaborative settings, fostering critical thinking and thorough investigation.
- Virtual Sticky Notes: Utilize online whiteboarding tools with virtual sticky notes for flexibility and collaborative brainstorming during remote sessions.
- Data Verification: Once potential causes have been identified, follow up with data collection and analysis to verify their actual impact.
Pros:
- Clear categorization of potential causes
- Distinguishes between root causes and symptoms
- Encourages systematic thinking
- Effective for team problem-solving (especially in remote settings)
- Comprehensive visual representation of problem sources
Cons:
- Not designed for solution brainstorming
- Can oversimplify complex problems with numerous interacting factors
- May not capture all the nuances of cause interactions
- Less intuitive for creative idea generation
Learn more about Fishbone Diagram (Ishikawa)
The Fishbone Diagram is a valuable tool for any remote team looking to improve their problem-solving process, particularly in technical fields where systematic root cause analysis is essential. Its visual nature and structured approach make it ideal for collaborative brainstorming and ensure a thorough exploration of all potential contributing factors.
5. Bubble Map
The Bubble Map is a valuable brainstorm graphic organizer perfect for diving deep into the descriptive qualities of a central idea. It's a visually simple yet powerful tool that uses a cluster of "bubbles" to explore attributes and characteristics, making it an excellent choice for remote teams, tech teams, and startups looking to thoroughly define concepts, products, or even team roles.
At its core, a Bubble Map consists of a central bubble containing the main subject – this could be anything from a project goal to a user persona. Surrounding this central bubble are connected bubbles containing descriptive words or phrases related to the main subject. Unlike other brainstorm graphic organizers like mind maps which focus on hierarchical relationships, Bubble Maps concentrate solely on describing the central concept. This focus makes them particularly useful for remote teams who need to establish a shared understanding of a specific item or idea, ensuring everyone is on the same page.
How it Works:
The simplicity of the Bubble Map is its strength. Start by placing the core concept in the central bubble. Then, brainstorm adjectives, descriptive phrases, and related terms that describe this concept. Place each descriptor in its own bubble, connecting it to the central bubble with a simple line. There's no need for directional arrows, as the focus is purely descriptive.
Features and Benefits:
- Central Bubble: Houses the main subject, providing a clear focal point for the brainstorming session.
- Descriptive Bubbles: Contain adjectives, phrases, and related terms that describe the central concept.
- Simple Connections: Lines connect the central bubble to the surrounding bubbles, emphasizing the descriptive relationship.
- Visual Organization: Color-coding can be used to categorize different types of descriptions, further enhancing clarity and organization, particularly helpful for visual thinkers in remote settings.
Pros:
- Develops Descriptive Vocabulary: Perfect for fleshing out ideas and ensuring a shared understanding of terminology within a remote team.
- Visually Accessible: Easy to understand and use, regardless of technical expertise, fostering inclusive participation in brainstorming sessions.
- Focused Thinking: Promotes concentrated brainstorming on attributes, ideal for remote teams working on specific product features or project requirements.
- Easy Implementation: Can be quickly created using digital whiteboard tools or even simple pen and paper, making it adaptable for various remote work setups.
Cons:
- Limited for Complex Relationships: Not suitable for exploring cause-and-effect relationships or sequential processes. For those scenarios, a different brainstorm graphic organizer might be more appropriate.
- Less Effective for Sequential Information: Not ideal for outlining steps or procedures.
- Can Be Repetitive: For highly complex subjects, the descriptive nature of the Bubble Map can become repetitive and less effective.
Examples for Remote Teams:
- Defining User Personas: A central bubble containing "Ideal Customer" can be surrounded by descriptors like "Tech-Savvy," "Problem-Solver," and "Early Adopter," enabling a remote team to build a detailed picture of their target audience.
- Product Development: Defining the core features and attributes of a new software application. A central bubble labeled "New App" could have surrounding bubbles describing features like "User-Friendly Interface," "Secure Data Encryption," and "Cross-Platform Compatibility."
- Team Roles and Responsibilities: Clarifying the roles within a remote team. A central bubble with "Project Manager" could be surrounded by descriptors like "Communication Hub," "Resource Allocator," and "Progress Tracker."
Tips for Effective Use:
- Start with a Noun: The central bubble should always contain a noun representing the core concept.
- Use Vivid Language: Encourage team members to use descriptive adjectives and phrases to paint a rich picture of the subject.
- Consider All Five Senses: If applicable, prompt the team to think about how the concept relates to sight, sound, smell, taste, and touch. This is particularly relevant for product development teams.
- Use Color-Coding: Assign different colors to different categories of descriptions to enhance visual organization.
- Combine with Other Tools: For more complex brainstorming sessions, consider pairing the Bubble Map with other brainstorm graphic organizers to capture different aspects of the topic.
The Bubble Map earns its place on this list due to its simplicity and effectiveness in descriptive brainstorming. It’s a valuable tool for remote teams, tech teams, and startups who need to clearly define and understand the attributes of their projects, products, and even team roles. While it's not ideal for complex relationships or processes, its focused approach to description makes it an invaluable asset for distributed teams aiming to build a shared understanding and vocabulary.
6. Tree Diagram
A Tree Diagram is a powerful brainstorm graphic organizer perfectly suited for remote teams, tech teams, and startups looking to break down complex projects or ideas into manageable components. It's a hierarchical organizer, resembling a tree with branches, that visually represents the relationships between a general concept and its more specific parts. This makes it incredibly useful for classification, organization, and structured brainstorming sessions, especially when a clear, top-down approach is needed.
This method works by starting with a central idea, the "trunk" of the tree. From this trunk, you branch out into major categories, represented by the primary branches. These branches then further divide into subcategories and details via secondary branches, and so on. This hierarchical structure, flowing either top-down or left-to-right, provides a clear visual representation of how different components relate to the overarching concept.
Features and Benefits:
- Clear Hierarchy: The tree structure clearly displays the relationships between general and specific concepts, making it easy to understand the breakdown of a complex topic.
- Categorization: Tree Diagrams excel at categorizing ideas, ensuring that all aspects of a project are considered and organized systematically.
- Structured Brainstorming: This method provides a framework for brainstorming, helping teams stay focused and avoid tangential discussions.
- Simplified Complexity: Breaking down large, complex projects into smaller, manageable parts makes them less daunting and easier to tackle, especially for remote teams working asynchronously.
Pros:
- Excellent for organizing hierarchical information.
- Creates clear categorization of ideas.
- Shows relationships between general and specific concepts.
- Helps break down complex topics into manageable parts.
- Useful for planning and outlining.
Cons:
- Limited flexibility for cross-connections between branches.
- Less effective for non-hierarchical relationships.
- Can oversimplify complex systems with multiple interactions.
- Not ideal for creative, non-linear thinking.
Examples of Successful Implementation:
- Project Management: Project managers in remote tech teams can utilize Tree Diagrams to create Work Breakdown Structures (WBS), effectively mapping out project deliverables and tasks.
- Software Development: Programmers can use them to visualize function hierarchies within a codebase, facilitating better understanding and collaboration.
- Business Analysis: Business analysts in remote startups can create organizational charts or break down market segments using Tree Diagrams.
- Scientific Classification: Biologists frequently use tree diagrams for taxonomic classifications, demonstrating the evolutionary relationships between species. Think of Charles Darwin's "tree of life" concept.
Actionable Tips for Using Tree Diagrams:
- Start with the Trunk: Clearly define the single, core concept at the top or trunk position of your diagram.
- Main Branches First: Establish the major categories or divisions before delving into subcategories.
- Consistent Specificity: Maintain consistent levels of detail within each branch level to ensure clarity and avoid confusion.
- Horizontal Format: For highly complex structures, consider using a horizontal format for better readability.
- Clear Labeling: Label each branch clearly and concisely to show the relationships between components.
This brainstorm graphic organizer earns its place on this list due to its effectiveness in dissecting complex subjects. It provides a visual roadmap, particularly helpful for remote teams who need to align on shared understanding and project scope. This visual approach makes it easier for distributed teams to collaborate effectively, ensuring everyone is on the same page throughout the project lifecycle. The Tree Diagram's structured approach to brainstorming ensures that every aspect of a project is thoroughly considered, promoting comprehensive planning and successful execution, which is crucial for remote tech teams and startups. Using this method in conjunction with other brainstorm graphic organizers can lead to more robust and comprehensive brainstorming sessions.
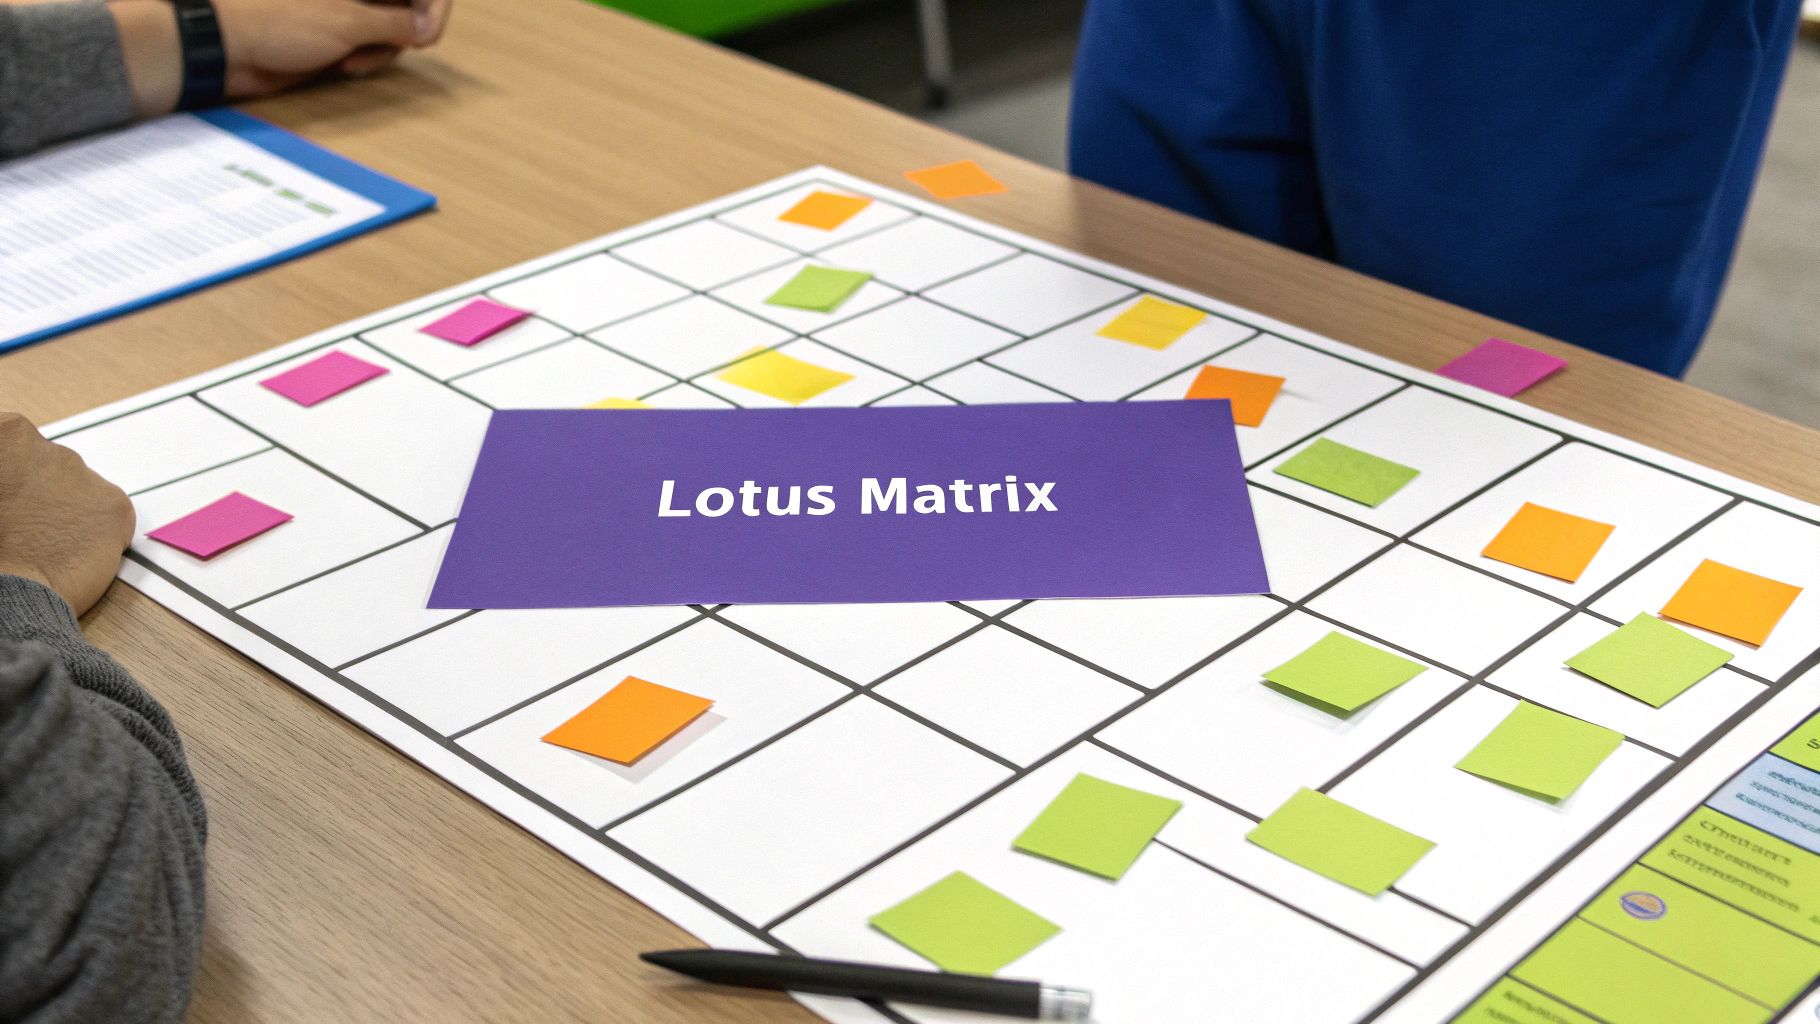
7. Lotus Diagram
The Lotus Diagram is a powerful brainstorm graphic organizer particularly well-suited for remote teams, tech teams, and startups looking for a structured yet creative approach to brainstorming. It employs a unique 3×3 grid, resembling a lotus flower, to systematically expand on a central idea. This method starts with a core concept placed in the center square. Around this central square are eight related idea boxes. Each of these eight ideas then has the potential to become the center of its own 3×3 grid, branching out the brainstorming process from 9 initial squares to a comprehensive 81-square diagram. This structured expansion fosters both divergent and convergent thinking, allowing for a broad exploration of ideas while simultaneously organizing them in a logical manner.
This method earns its spot on this list due to its ability to combine creative thinking with systematic organization. It's particularly valuable for remote teams who need a clear and shared visual framework for brainstorming, as it prevents the chaotic free-for-all that can sometimes occur in virtual brainstorming sessions. The structured layout makes it easier to follow the thought process and ensures everyone on the distributed team stays on the same page. For remote tech teams working on complex projects, this visual organization is crucial for dissecting problems, exploring potential solutions, and developing detailed product features. Similarly, remote startups can leverage the Lotus Diagram to thoroughly flesh out business opportunities, marketing campaigns, and product development strategies in a collaborative and organized way.
Features and Benefits:
- Structured Expansion: The core 3×3 grid expands to 81 squares, providing ample space for detailed idea generation. This is especially useful for remote tech teams who need to delve deep into technical specifications or explore intricate coding solutions.
- Natural Categorization: The branching structure creates natural categories and groupings, making it easy to visualize connections between ideas and identify potential overlaps or conflicts.
- Overcoming Mental Blocks: The structured format helps overcome mental blocks by providing a clear framework to follow. This can be incredibly beneficial for remote startups facing challenging market conditions or tight deadlines.
- In-depth Development: The Lotus Diagram excels at developing ideas in greater depth and detail, a crucial aspect for remote teams working on complex projects that require thorough planning and execution.
Pros:
- Combines creative thinking with systematic organization.
- Prevents chaotic brainstorming while encouraging idea generation.
- Creates natural categorization and grouping of ideas.
- Helps overcome mental blocks by providing structure.
- Excellent for developing ideas in greater depth and detail.
Cons:
- More complex to explain and implement than simpler brainstorming methods.
- Can be time-consuming to complete fully.
- Requires larger paper or digital space for full implementation.
- May feel constraining for highly creative thinkers.
Examples:
- Remote product design teams expanding on product features and user interface elements.
- Remote marketing departments developing comprehensive campaign concepts across various digital channels.
- Remote content writers developing plot points, character details, and narrative arcs for articles or stories.
- Remote teams in strategic planning sessions exploring new business opportunities and market entry strategies.
Tips for Remote Teams:
- Start with a Clear Central Concept: Ensure everyone on the team understands and agrees on the core concept before beginning the expansion process.
- Use a Digital Whiteboard: Leverage collaborative digital whiteboarding tools like Miro or Mural for seamless real-time collaboration across locations.
- Use Virtual Sticky Notes: Replicate the flexibility of physical sticky notes within the digital whiteboard for easy rearranging and grouping of ideas.
- Complete One Level Fully Before Expanding: This helps maintain focus and prevents the diagram from becoming overwhelming.
- Use Color-Coding: Track different categories, themes, or team member contributions using color-coding within the digital whiteboard.
By leveraging the Lotus Diagram, remote teams, tech teams, and startups can unlock a structured and comprehensive approach to brainstorming, fostering innovative solutions and driving project success.
7 Graphic Organizer Formats Compared
| Format | Implementation Complexity 🔄 | Resource Requirements ⚡ | Expected Outcomes 📊 | Ideal Use Cases 💡 | Key Advantages ⭐ |
|---|---|---|---|---|---|
| Mind Map | Medium – flexible but can get cluttered | Low to Medium – paper or digital tools | Visualize connections and hierarchy of ideas | Brainstorming, creative thinking, essay planning | Encourages creativity, easy to expand, visual |
| Concept Map | High – requires precise linking and structure | Medium to High – software recommended | Shows complex, cross-linked relationships | Technical subjects, research frameworks, systems | Excellent for detailed relationships, structured |
| Web Diagram (Spider Map) | Low – very simple radial layout | Low – minimal tools needed | Quick idea categorization, initial brainstorming | Quick ideation, K-12 classrooms, simple topics | Fast to create, accessible, less intimidating |
| Fishbone Diagram | Medium – structured but straightforward | Medium – requires templates/software | Identify and organize potential causes of problems | Problem solving, root cause analysis, quality control | Clear cause categorization, systematic thinking |
| Bubble Map | Low – simple circle connections | Low – minimal tools needed | Develop descriptive attributes around a concept | Vocabulary, describing characteristics, language arts | Focuses on attributes, visual simplicity |
| Tree Diagram | Medium – hierarchical with clear levels | Low to Medium – paper or diagram tools | Classification and breakdown of complex topics | Organizational charts, classifications, planning | Clear hierarchical organization, easy to understand |
| Lotus Diagram | High – complex grid expansion | Medium to High – large space or digital tools | Systematic idea expansion with depth & breadth | Strategic planning, product development, advanced brainstorming | Combines creativity with structure, scalable |
Boosting Collaboration and Innovation
Brainstorm graphic organizers, from mind maps and concept maps to fishbone diagrams and lotus diagrams, are essential tools for remote teams looking to boost collaboration and innovation. These visual aids provide a structure that makes brainstorming sessions more productive, especially when distance can create communication challenges. By using a brainstorm graphic organizer, remote tech teams and startups can effectively capture ideas, identify relationships between concepts, and analyze potential roadblocks. Mastering these techniques is invaluable for fostering a creative environment, aligning team members, and ultimately, driving project success.
The key takeaway is that the right brainstorm graphic organizer can transform a scattered brainstorming session into a focused and fruitful endeavor. Experimenting with different types like the web diagram, bubble map, or tree diagram will help your team find the perfect fit for various project needs and brainstorming styles. This structured approach fosters clarity, encourages participation, and ultimately leads to more innovative solutions.
Ready to take your brainstorming sessions to the next level? Bulby streamlines the process of using brainstorm graphic organizers, offering collaborative features and AI-powered insights to amplify your team’s creative potential. Visit Bulby today and discover how you can unlock even greater innovation within your remote team.