User research isn't just about collecting data; it's about systematically understanding the people you're building for. It’s a mix of watching how they work, analyzing what they're trying to accomplish, and listening to their feedback. The whole point is to swap out our own assumptions for real-world evidence.
Why User Research Is Your Secret Weapon

Before we jump into the "how-to," let's get clear on the why. A lot of teams see user research as an optional add-on, but it's actually a core strategic advantage. It’s what separates a product you think people want from a product they actually can't live without.
Too many teams fall into the trap of building something loaded with cool-looking features that don't solve a real problem. They're running on gut feelings and internal opinions, which almost always leads to expensive redesigns and a product that nobody uses. User research is your reality check. It grounds every decision in what your users actually do and say.
The Real-World Business Impact
When you bring user insights into the process early and often, you see a direct impact on the bottom line. It saves countless engineering hours that would have been wasted on features nobody asked for. Your product roadmap starts to align with what customers genuinely need.
The link between research and business success isn't just a theory; it's backed by solid numbers.
A detailed study of 800 product professionals found that teams that fully integrate user research see 2.7 times better business outcomes than those that don't. That translates to real, measurable wins.
Key Benefits of Integrating User Research
This table breaks down some of the tangible improvements teams see when they consistently talk to their users.
| Business Outcome | Reported Improvement |
|---|---|
| Improved Product Usability | 73% of teams report significant gains. |
| Increased Customer Retention | 60% see a positive impact on loyalty. |
| Enhanced Product Quality | 68% notice a direct lift in quality. |
The data tells a clear story: putting users first isn't just a nice idea—it's just smart business.
From Afterthought to Core Function
The most successful companies treat user research as a core business function, not a "nice-to-have." It’s what fuels the deep customer empathy that separates market leaders from everyone else. When you know your users better than your competitors do, you can see their needs coming and build solutions that hit the mark every time.
When user research becomes a habit, you create a powerful feedback loop. That loop starts to inform everything you do, from small UI tweaks to major strategic shifts, making sure you never lose sight of the person you're building for.
This mindset is at the heart of modern processes of innovation and is what helps you:
- Slash Risk: You get to validate ideas before you sink a ton of time and money into them.
- Drive Adoption: When you solve a real problem, your product becomes essential.
- Build Loyalty: Customers stick around when they feel heard and understood.
Laying the Groundwork for Insightful Research
A great user research study doesn't just happen. It starts with a solid plan. If you dive in without a clear direction, you'll end up with a mountain of noisy, confusing data that sends your team running in circles. The real goal here is to transform a vague curiosity into a focused investigation that delivers sharp, actionable insights.
Think of it like building a house—you wouldn't just start laying bricks without a blueprint. Your research plan is that blueprint. It ensures every single thing you do serves a purpose and helps build a strong foundation of understanding. This is where you decide what "success" looks like long before you talk to your first user.
Define Your Research Objectives
First things first: you have to know what you need to learn. Vague goals like "find out what users think" are a recipe for disaster. You need to get specific. Are you trying to figure out why a new feature is tanking? Or maybe you want to pinpoint the biggest frustrations in your onboarding flow.
For example, let's say a team sees terrible engagement with their new project management dashboard. A good objective would be: "Understand why users are not adopting the new dashboard and identify the top three friction points they encounter." See how that’s a measurable, focused goal? It gives you a North Star to follow.
Getting this kind of clarity often starts with a well-defined problem statement. If you're having trouble framing the challenge, our guide on defining a problem statement can help you nail down exactly what you’re trying to solve.
Choose the Right Research Method
Once your objective is locked in, it’s time to pick the right tool for the job. The research method you choose hinges entirely on what you're trying to find out. There's no one-size-fits-all answer here.
- In-Depth Interviews: Perfect for when you need to understand the "why" behind user behaviors and feelings. They let you dig deep into complex issues.
- Usability Testing: This is your go-to for finding friction. You get to watch real people use your product and see exactly where they get stuck or confused.
- Surveys: Great for gathering quantitative data from a large audience, which can help validate patterns you spotted in smaller, qualitative studies.
For that team with the underused dashboard, a mix-and-match approach would be powerful. They could kick things off with five to eight in-depth interviews to get to the root of the frustrations, then follow up with a usability test to watch those specific interaction problems happen in real-time.
This visual breaks down how your objectives connect directly to the methods you choose and the questions you'll ask.
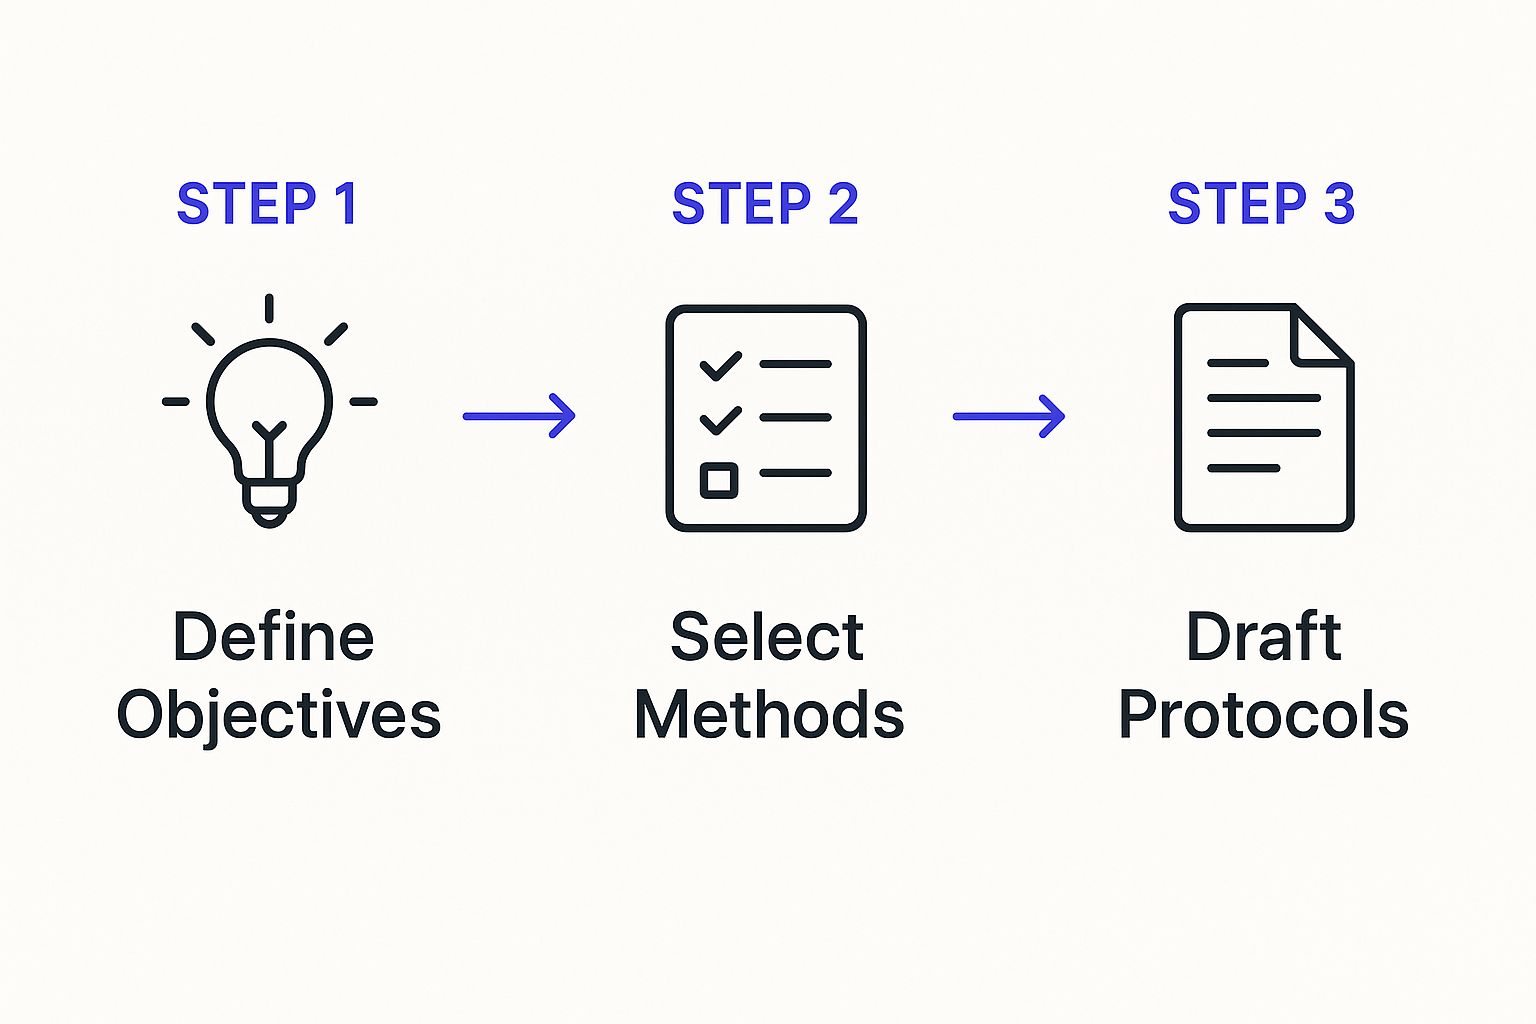
Following this simple flow ensures your research activities are directly tied to your learning goals, so you don't waste a minute of your time.
Find and Recruit the Right Participants
The insights you gather are only as good as the people you talk to. Seriously. Recruiting the wrong participants is one of the easiest ways to derail a study. If you’re researching an advanced feature for power users, feedback from brand-new customers will be completely misleading.
Your research plan must clearly define your ideal participant profile. Get specific about their role, their experience level with your product, and any other key behaviors. This precision makes sure the feedback comes from the people whose opinions actually matter for the problem you’re solving.
Running Research Sessions That Generate Real Insights
Alright, you've done the prep work and your plan is locked in. Now comes the moment of truth: running the actual research sessions. Whether you’re conducting live interviews or sending out unmoderated tests, how you handle this phase will make or break the quality of your findings.
The simple fact is, a participant who feels comfortable and heard is going to give you gold. One who feels like they're being tested or led down a path? Not so much. The trick, especially for remote teams, is learning how to build that connection through a screen.
For a deep dive into this, exploring some essential techniques for building rapport with customers can be a game-changer.
Moderating Effective User Interviews
When you’re running a one-on-one interview, your most important job is to listen. Seriously. Zip it and listen. Your goal is to get the participant talking, sharing their real-world experiences and thought processes. The best tool you have for this? Open-ended questions.
You need to ask questions that can’t be answered with a simple “yes” or “no.” More importantly, you need to avoid leading the witness.
Let's look at an example.
- Poor Question: "Don't you think this new dashboard is much easier to use?" This just pressures the user to agree with you. You learn nothing.
- Better Question: "Walk me through how you would find your project tasks on this screen." This gets them to do something and think out loud, showing you exactly where the friction is.
That small tweak in phrasing changes the entire dynamic from seeking validation to genuinely learning. If you need some inspiration, check out these samples of open-ended questions to start building your own interview script.
I’ve found that the most powerful insights often emerge from silence. After a participant answers a question, just wait. Count to five in your head. That little pause gives them the space to add something else—often, it’s the most important thing they’ll say.
Running Unmoderated Tests and Surveys
When you’re not there to guide someone, clarity is everything. For unmoderated usability tests or surveys, your instructions have to be absolutely foolproof. Any ambiguity will just lead to messy, unreliable data.
This is where purpose-built user research platforms are so valuable. They create a structured way for participants to complete tasks on their own time, all while capturing screen recordings, click-through paths, and qualitative feedback without you having to be there.

Tools like these let your team get feedback quickly and at a much larger scale than you could with moderated interviews alone.
The industry is leaning heavily into these solutions. The global user experience research software market was valued at $427.3 million in 2024 and is on track to hit $1.03 billion by 2032. That growth tells you just how vital these tools have become for any team that wants to make data-informed decisions.
Ultimately, it doesn't matter if you're on a live call or building a survey. Your job is to create an environment that encourages honesty, watch what users do, and let their voice lead you to the insights that truly matter.
Turning Raw Data Into Actionable Findings
So, you've wrapped up your interviews and the survey results are in. You’re looking at a mountain of recordings, transcripts, and notes. This is a great first step, but raw data is really just noise. The real magic happens in the synthesis phase—this is where you turn all those disconnected observations into clear, actionable insights that will actually guide your team.
This part of the process is less about counting things and more about uncovering the patterns hiding in plain sight. You’re shifting from a simple list of what users said and did to a much deeper understanding of why they did it. Think of it as the difference between noting "User A couldn't find the export button" and concluding, "Our export function is buried in a settings menu that new users rarely open, causing significant confusion."
Finding Patterns with Affinity Mapping
One of the best ways I’ve found to make sense of qualitative data is affinity mapping, sometimes called an affinity diagram. It’s a deceptively simple technique that works wonders for remote teams, especially with digital whiteboards like Miro or Mural.
The process is straightforward. You take individual observations, powerful quotes, or ideas and jot them down on digital sticky notes. Then, as a team, you start grouping them based on themes that begin to emerge organically.
For example, after a few interviews, you might have a collection of notes that say things like:
- "I wasn't sure where to save my work."
- "The auto-save feature made me nervous; I like to click save."
- "I looked everywhere but couldn't find a ‘save’ button."
You’d probably cluster these together under a theme like "Anxiety Around Saving Progress." As you continue adding and grouping more notes, the big-picture patterns and user pain points become impossible to ignore. It really helps you see the forest for the trees. For a closer look at how this plays out, check out these helpful affinity diagram examples.
The real power of affinity mapping isn't just in organizing notes. It's about building a shared understanding across your team. When everyone participates in sorting the data, the insights feel co-owned and are far more likely to get acted on.
Backing Up Insights with Quantitative Data
While qualitative methods give you the rich "why" behind user behavior, quantitative data from surveys and analytics tells you the "how many." This is what adds serious weight to your findings and helps stakeholders grasp the scale of a problem.
Let's say your interviews revealed that users are getting tripped up by a new feature. You can jump into your product analytics to validate that. Do you see a high drop-off rate on that specific screen? That number is the proof. Combining the "what" (from analytics) with the "why" (from your interviews) creates a compelling story that's hard for anyone to dismiss.
This kind of analytical rigor is what makes the entire user experience discipline so valuable. The growing demand for these skills is clear when you look at the numbers. Projections show the global UX market is expected to grow from $11.57 billion in 2025 to $26.05 billion by 2030. You can dig into the specifics in this report on the UX market growth.
Ultimately, your analysis should boil down to a handful of clear, concise insight statements. These aren't just observations—they're synthesized truths about your users that point directly to opportunities for improvement. They make it crystal clear what your team needs to tackle next.
Sharing Insights That Inspire Action

Even the most incredible research findings are worthless if they’re just left to die in a forgotten folder. The last and most critical piece of the user research puzzle is turning what you’ve learned into real, tangible action. This is all about sharing your insights in a way that connects with stakeholders and actually motivates them to make changes.
The real goal here is to get past the dry data dumps. You need to tell a compelling story that makes the user’s experience feel real to people who weren't there for the sessions. That's how you get the entire team to care about solving the problems you've spent so much time uncovering.
Crafting a Narrative with Your Data
Think of your research report or presentation less like a list of facts and more like a story with a beginning, middle, and end. Start by setting the scene with your research goals, then introduce the users and the core struggles you observed. Nothing is more powerful than using direct quotes and short video clips from your sessions to let the user's own voice do the talking.
This simple shift changes abstract data points into relatable human stories. A developer seeing a statistic on a slide is one thing, but hearing a user say, "I felt so stupid when I couldn't find the save button," hits on a completely different level.
Of course, the narrative needs support. Following established data visualization best practices helps you create simple, clear charts that back up the human stories you’re telling without overwhelming your audience.
A great research share-out doesn’t just present problems; it creates a shared sense of urgency and purpose. The team should walk away not just knowing what’s wrong, but feeling motivated to fix it for the people they serve.
From Insights to Actionable Recommendations
It’s easy to get these two mixed up, but an insight identifies a user problem, while a recommendation proposes a way to fix it. This is a crucial distinction. Every key insight you share must be paired with a clear, actionable recommendation.
For example, an insight might be: "Users are overwhelmed by the number of options in the main navigation." A weak recommendation would be "Fix the navigation." A much better, more actionable one would be: "We recommend consolidating the 'Settings,' 'Profile,' and 'Account' menus into a single user dashboard to reduce cognitive load."
You can check out some great actionable insights examples to get a feel for how to turn raw observations into clear directives for your team.
This direct line from problem to potential solution makes it much easier for your team to see the path forward and prioritize what to work on next.
Build a Central Research Repository
Your hard work shouldn’t be a one-time event. The best way to make sure it has a long-term impact is to create a centralized, easy-to-access place where all your research findings live. This research repository essentially becomes your company's institutional memory about its users.
This living library helps new team members get up to speed on past learnings and prevents teams from accidentally redoing old research. Over time, it builds a deep, collective understanding of your customers across the entire organization.
The right way to share your findings often depends on who you're talking to. The table below breaks down a few common methods and when they work best.
Choosing the Right Communication Method
| Method | Best For | Key Benefit |
|---|---|---|
| Live Presentation | High-priority findings for key stakeholders. | Creates immediate dialogue and alignment. |
| Detailed Report | Providing deep context for product teams. | Serves as a lasting document for reference. |
| Email Summary | Keeping the wider company informed. | Builds broad awareness of user needs. |
Choosing the right format ensures your message not only gets heard but also gets acted upon, which is the ultimate goal of any research project.
Common User Research Questions Answered
Even with a solid plan, you're bound to run into questions once you start doing the work. Let's tackle some of the most common ones that trip teams up, especially when they're new to user research.
How Many Users Do I Need to Interview?
This is probably the number one question I get asked. There’s no single magic number, but for qualitative studies like user interviews, a good rule of thumb is 5 to 8 users for each distinct customer segment you’re exploring.
Why so few? It’s because the goal isn't to get a statistically significant sample size. You're looking for patterns.
You might have heard of the famous Nielsen Norman Group study that found interviewing just five users uncovers about 85% of the usability problems. It's a classic for a reason—it holds up.
You’ll know you've talked to enough people when you start to experience a bit of déjà vu. Researchers call this "saturation." It’s that point where you can almost predict what the next person is going to say. When the feedback gets repetitive, you can be pretty confident you’ve nailed the core issues.
What Is the Difference Between Qualitative and Quantitative Research?
Getting this straight is fundamental. The easiest way to think about it is the difference between the "why" and the "what."
-
Qualitative Research is all about the why. It digs into the reasons behind what people do. Think interviews, usability tests, and diary studies. The data you get is non-numerical—quotes, stories, and observations that help you understand motivations and frustrations on a human level.
-
Quantitative Research focuses on the what and how many. This is where you get measurable, numerical data from things like large-scale surveys or product analytics. It’s what you use to spot trends or validate a hypothesis across a much larger group of people.
Honestly, the best research strategies use both. You might do a few qualitative interviews and discover a really painful issue for a handful of users. Then, you could run a quantitative survey to find out if that same problem affects thousands of others.
A great way to remember the difference: Qualitative data tells you a compelling story about one user's struggle. Quantitative data tells you how many other users are living that same story.
How Can I Conduct User Research on a Tight Budget?
You absolutely do not need a massive budget to get valuable insights. So many powerful research methods are low-cost or even completely free. This is often called guerrilla research—it's all about being scrappy and finding creative ways to get feedback.
Here are a few ideas to get you started:
- Tap into your existing network: Your current customers are a goldmine. Recruit them through an email newsletter or a quick social media post.
- Get creative with incentives: You don’t always have to offer cash. A discount on your product, a free month of service, or even a simple gift card can work wonders.
- Lean on free tools: Google Forms is perfect for simple surveys. Many user testing platforms also offer free plans that are great for unmoderated tests.
The most important thing is to just start talking to people. The insights you gain from even a handful of real conversations will always be more valuable than operating on assumptions alone.
Ready to turn those user insights into brilliant ideas? Bulby provides a structured, AI-powered platform that guides your remote team through brainstorming sessions, helping you develop creative solutions based on your research. Transform your findings into action at https://www.bulby.com.