
If your team generated more ideas this month than last, does that mean you've gotten better at innovation? It's a fair question, and the honest answer is that idea volume alone can't tell you. You may have had one busy workshop, one loud pitch, or one client who demanded options fast.
An innovation maturity assessment answers a different question. It asks whether your team can innovate repeatedly, not just once. Think of the score as a diagnostic map, not a label. It shows which capability blocks the next level, so you know what to fix first.
Table of Contents
- Innovation Maturity Levels at a Glance
- What an Assessment Actually Measures
- How to Run an Assessment in Six Steps
- Reading Your Results and Heat Map
- A Creative Agency Scores Itself
- Common Mistakes and Edge Cases
- Turn Your Lowest Score Into a 30-Day Sprint
Innovation Maturity Levels at a Glance
Five levels are easier to read as a staircase than as a label. Each step answers one question: what has to be true before the next level is stable?
At Level 1, ideas appear by chance and no one owns them. At Level 2, change happens because a client, rival, or crisis pushes you. At Level 3, you plan the work, yet results still rest on a few key people. At Level 4, you run a repeatable process with owners and reviews. At Level 5, you also review and improve that process itself.
Find Your Band in the Table
Use the table below to look up your band. It comes from one published model with a maximum total score of 320, built from statements rated 1 to 5, as described in the Telin maturity level assessment using an innovation capability maturity model. Find your total, note your level, and treat the next level as the target.
| Level | Stage | What It Looks Like | Score Band (out of 320) |
|---|---|---|---|
| Level 1 | Lack of innovation | Ideas appear by chance, with no owner or budget | Up to 160 |
| Level 2 | Forced innovation | Change happens only when a client, rival or crisis demands it | 161-208 |
| Level 3 | Planned innovation | Schedules and budgets exist, but results depend on a few people | 209-240 |
| Level 4 | Innovation management | A repeatable process with owners, reviews and metrics | 241-288 |
| Level 5 | Continuous improvement | The innovation process itself is reviewed and tuned | 289-320 |
A Borderline Result From One Case
The Telin case shows why scale matters. In that study, 79 employees scored a mean of 4.18 on a 1 to 5 scale, placing the company between Levels 4 and 5. That is useful evidence for a near-border result inside one organization.
Keep the units separate. A mean of 4.18 is not a 320-point total, so you cannot drop it into the table bands above. If your tool gives a different score, convert only within that tool's rules or rescoring will mislead you.
Practical rule: Match the score to its own tool and its own thresholds. A number means little without its scale.
These bands are one reference, not a universal standard. Cut-offs differ between tools, so keep the same tool when you rescore. Building the habits behind the higher levels also connects to how you shape a wider culture of innovation in daily work.
What an Assessment Actually Measures
What does a maturity score count?
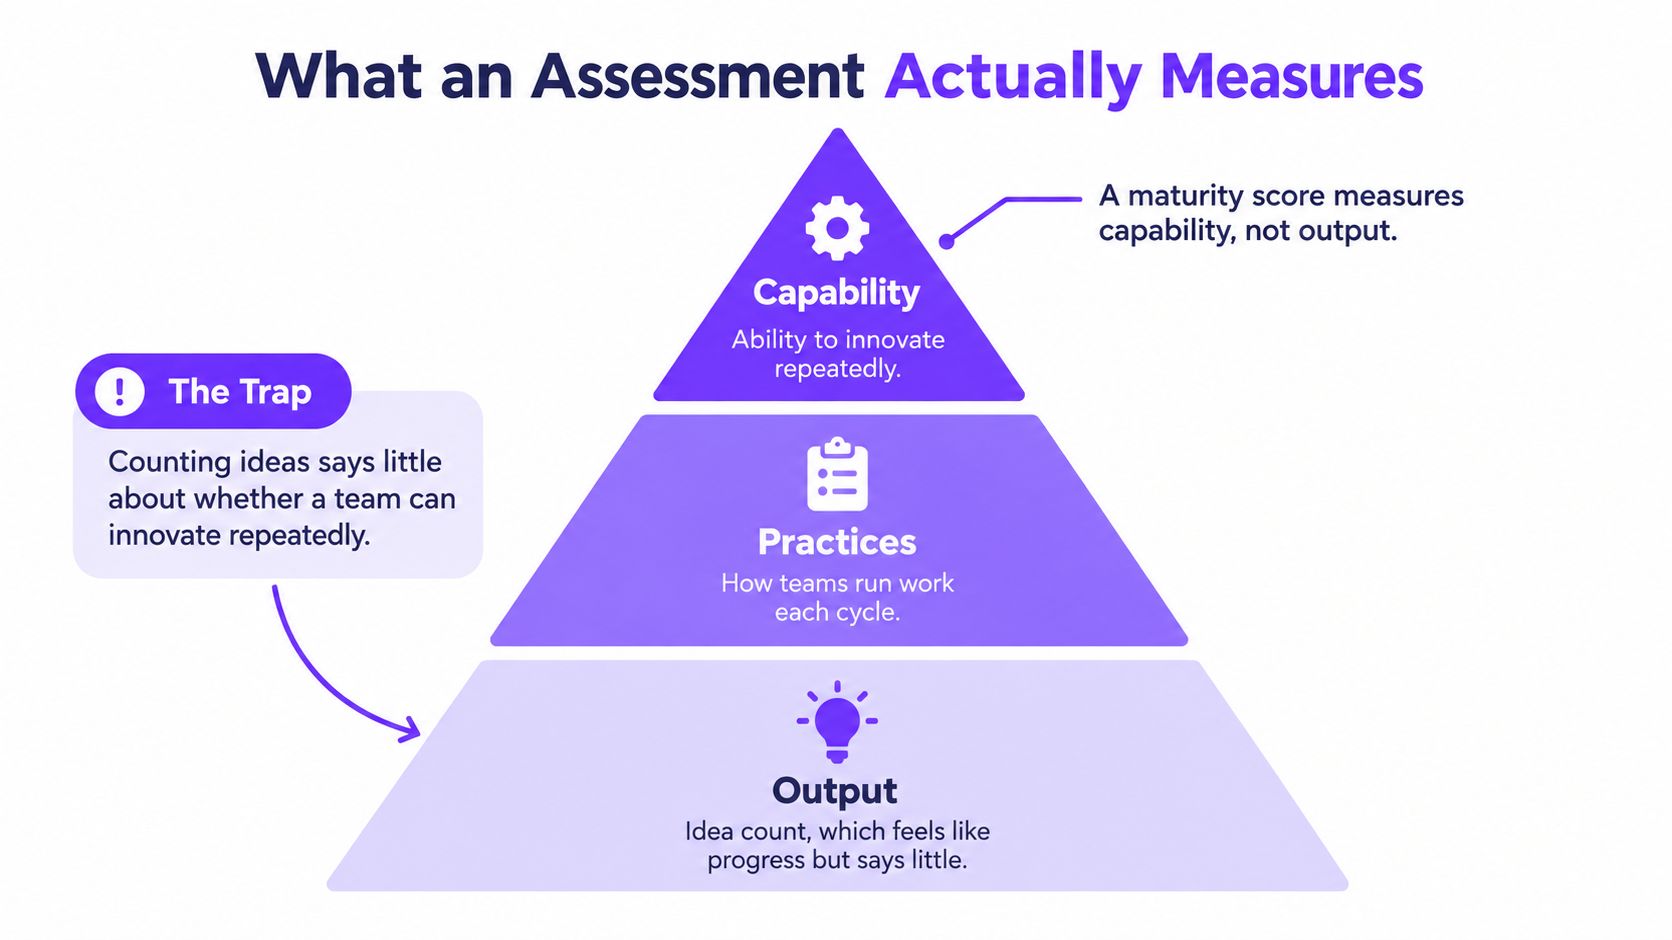
Counting ideas feels like progress. The board fills up. The sticky notes look impressive. A full board can hide a weak process, though, because it says nothing about whether those ideas get tested, chosen well, or used. Idea count is the most common wrong measure in this whole exercise.
Here's the plain point. A maturity score measures capability: whether your team can frame a problem, bring in the right input, pick a concept for clear reasons, test it, and learn from the result. Read it as a diagnostic map. Each low score marks the capability blocking your next level.
Why There Is No Single Universal Score
Research on innovation maturity grew as a structured field during the 2000s. A systematic mapping study reviewed 78 high-quality primary studies from 2000 onward and found that models had multiplied while lacking a common ontology, a shared set of terms and definitions, so no model covered all relevant innovation capabilities, as reported in the systematic mapping study of innovation capability maturity models.
In plain words, different tools measure different mixes of capability. That variety is workable if you choose well. Back in 2009, researchers Essmann and Preez had already compared 16 maturity models in a single review, so teams have long had options to weigh. Published models commonly score broad organizational areas such as innovation climate, partnerships, internal processes, knowledge, actors, and operating context. Some models were designed specifically for non-R&D and low-technology firms, so this kind of assessment isn't only for research labs.
Similar thinking helps when a weakness is about technology rather than process. If your gaps involve tools and data use, Stimulead's practical AI readiness guide offers a parallel way to check readiness before you add new systems. For the measurement side, you'll also want clear views on how to measure innovation beyond simple counts.
Six Capabilities to Score
One honest note before the table. Those published areas describe a whole organization, which is more than a product or creative team needs. The six checks below are a practical framework built for this guide. They compress the common ground across published models into questions a team can answer session by session. Climate and partnerships still matter; they just sit upstream of what a single team controls.
| Dimension | Question to Ask | Sign of a Low Score |
|---|---|---|
| Problem framing | Is the real problem defined before ideas start? | Teams jump to solutions in the first minute |
| Diversity of input | Do ideas come from more than the usual voices? | The same three people shape most concepts |
| Research use | Is customer or market evidence used to shape ideas? | Concepts rest on opinion or past habit |
| Idea selection | Is there a clear, shared method for picking winners? | The loudest or most senior person decides |
| Experimentation | Are concepts tested with small, real trials? | Ideas stay in decks and never reach users |
| Learning | Are results reviewed and fed into the next cycle? | The same mistakes repeat every quarter |
Read the rows as cause and effect. If idea selection is weak, good concepts stall while weak ones move ahead. If research use is low, teams argue from opinion. The map points to the row that blocks you, and that row is where your next level begins.
How to Run an Assessment in Six Steps
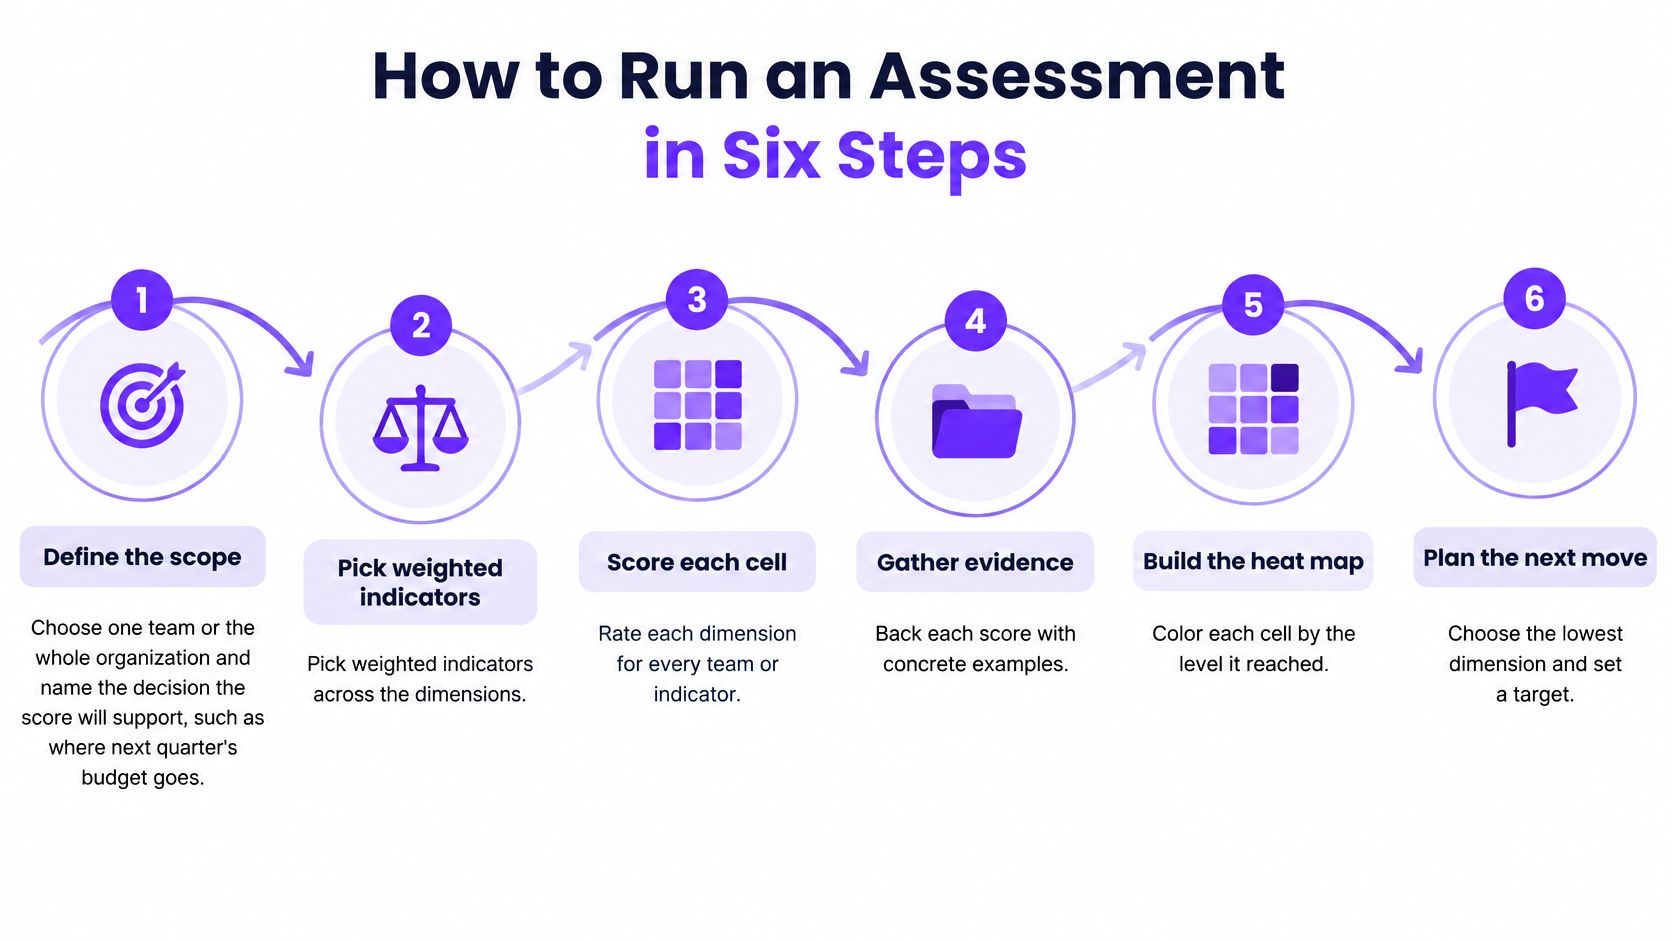
You don't need a large program to start. You need a clear scope, fixed thresholds, honest scoring, and a date to score again. Run the steps in order, because each one protects the next from guesswork.
The short flow below gives you the shape of the work before you start.
Steps 1 to 3 Set the Rules
Define the scope. Choose one team or the whole organization. Name the decision the score will support, such as where next quarter's budget goes. If no decision depends on it, the score will sit in a drawer.
Pick weighted indicators. Choose a small set across your dimensions. Useful examples include the share of sessions producing testable hypotheses, time from brief to selected concept, cross-functional participation, evidence attached to ideas, and the rate at which concepts move into experiments. Weight means you decide in advance which ones count more.
Set level thresholds before scoring. Write down what total counts as each level. Do this first, so no one can move the line later to make results look better.
Steps 4 to 6 Create the Baseline and the Change
Baseline the organization. Combine a short survey of statements rated 1 to 5 with records from real sessions. If you're drafting survey items, well-formed innovation survey questions help you ask about behavior, not just opinion. Add the ratings and read the total against your thresholds. For example, a 320-point instrument has 64 statements, because 64 times 5 equals 320.
Act on the lowest dimensions only. Pick the two or three weakest areas. Don't try to fix everything at once, or you'll learn nothing about what worked.
Rescore after a fixed period. Pick the date now, such as after two quarters. Use the same questions, same thresholds, and same scope.
A score you can't compare over time is just a snapshot. A baseline plus a rescore shows change.
This discipline has support beyond opinion. A study of 139 Italian companies using an ISO 56002-derived scale found a positive relationship between innovation management system maturity and innovation performance, with a structural path coefficient of 0.411 and p = 0.000, as reported in the study of innovation management system maturity in Italian companiesA30.pdf). In plain words, higher maturity and stronger performance moved together in that sample.
Track your indicators across the full period, not just on scoring day. That long view helps you tell genuine process improvement apart from a short spike in idea volume. One busy month shouldn't lift your level.
Reading Your Results and Heat Map
A heat map puts your scores in one picture. Put dimensions down the rows and teams or indicators across the columns. Color shows the level each cell reached, so weak spots stand out fast.
Read the gap, not just the number. For example, a team at 2.8 with a target of 3.0 needs a small push. A team at 2.8 with a target of 4.0 needs a bigger plan, more time, and probably a different owner. Same score, different job.

Use Patterns to Find the Bottleneck
Published models are most valuable when they name the areas that must change to reach the next level, not when they only assign a label, a point made in the overview of innovation maturity measurement models. That source describes models that score dimensions such as innovation climate, partnerships, internal processes, knowledge, actors, and operating context, then map them to staged levels. Your heat map should lead to a prioritized improvement backlog in the same spirit.
| Score Pattern | What It Usually Means | Where to Act First |
|---|---|---|
| All dimensions low | No shared process yet; innovation depends on individuals | Problem framing and one named owner for the process |
| One dimension low, others high | A single bottleneck blocks the rest | That dimension, such as idea selection |
| Process scores high, outcomes weak | The process is followed, but concepts are not tested | Experimentation and use of evidence |
| Idea volume up, scores flat | Activity without capability | Learning and idea selection |
| Scores and outcomes both up | Improvement is real | Raise the target and extend the process to new teams |
When one cell is low and the rest are strong, start there. If experiments stall, check idea selection first. Teams can't test what they never chose clearly. Then check evidence use, because weak evidence makes selection feel risky.
Pair Every Score With Outcome Data
Self-assessment runs generous. People remember their best sessions and forget the messy ones. So pair each score with outcomes you can check, such as experiments launched, time to concept, and concepts that reached users. If the score climbs while outcomes stay flat, the rating moved, not the capability.
Small teams need extra care. With a five-person team, one strong project can swing the score. Treat a small shift as a signal to discuss, not proof of change. Then write the top two gaps into your backlog, each with one owner and one target, so your next rescore tests something real.
A Creative Agency Scores Itself
Here's a short worked example. The agency and its numbers are hypothetical and illustrative, not a real case. Use it to see how the method feels in practice.
The agency has about 40 people and six client accounts. Its pitches feel stale. Leaders suspect fresh ideas only appear after a pitch is lost, when pressure is high and time is short. They want a process that works before a crisis, not only during one.
Baseline
The six dimensions average around Level 2, forced innovation. The pattern fits the daily story. Work starts late, the same senior voices lead, and concepts rarely carry customer proof.
The illustrative indicator readings look like this.
- Testable hypotheses: 35 percent of sessions produce one
- Time to concept: 9 days from brief to chosen concept
- Input mix: most sessions include only two departments
- Evidence attached: 20 percent of ideas carry evidence
Notice what the team didn't do. They didn't set a target for more ideas. The sessions already produced plenty of concepts, but few were testable and fewer still had evidence behind them.
Target and Changes
The target is Level 3 within six months. That's planned innovation, with schedules and budgets that don't depend on panic. The team picks three changes tied to its weakest dimensions.
First, a monthly brief template requires a written problem statement before any session starts. Second, a rotation brings a strategist, a creative, and an account lead into each session, so input is wider. Third, the team runs a short learning review after every campaign. When ideas need fast visual variants for testing, a tool such as the ShortGenius AI ad creative tool can help the team produce options to react to, while the selection method stays the team's own.
Rescore After Two Quarters
The illustrative rescore shows hypotheses at 60 percent, time to concept at 5 days, and evidence at 45 percent. The overall score moves into the Level 3 band. Idea volume stays roughly the same as before.
The level rose because the process changed, not because the agency generated more ideas.
That's the lesson to carry into your own scoring. Fewer stalled concepts, faster clear choices, and better evidence can lift maturity even when the idea count doesn't move. If the agency had only counted ideas, it would've missed its own progress.
Common Mistakes and Edge Cases
The most tempting mistake is treating the level as a trophy. Once a score becomes the target, teams learn to game it. They answer generously, pick easy indicators, or run one showcase project. Tie the score to outcomes instead, such as experiments run and concepts that reached users.
Six Traps and Their Fixes
- Borrowing cut-offs from another tool: Bands belong to the model that created them. Set your own thresholds before scoring if you use a different instrument.
- Self-scoring optimism: Add a second rater or an outside check. Ask raters to point to a real session as proof for each score.
- Scoring once: One snapshot can't show change. Book the rescore date when you publish the baseline.
- Small team swings: With five people, one project can move the average. Use the result to start a conversation, not as a hard benchmark.
- Cross-industry comparisons: Teams outside R&D need models built for their context, not research lab norms. Your blockers may be client approvals or handoffs, which connects to common barriers to innovation rather than lab capacity.
- Reading correlation as a promise: A positive relationship between maturity and performance doesn't mean each extra point buys a fixed gain. It means the two moved together in that study.
None of these traps means you should skip scoring. They mean you should score candidly, keep the method stable, and check the numbers against real work. A score is a diagnostic tool. Its value depends on the integrity of its inputs.
Turn Your Lowest Score Into a 30-Day Sprint
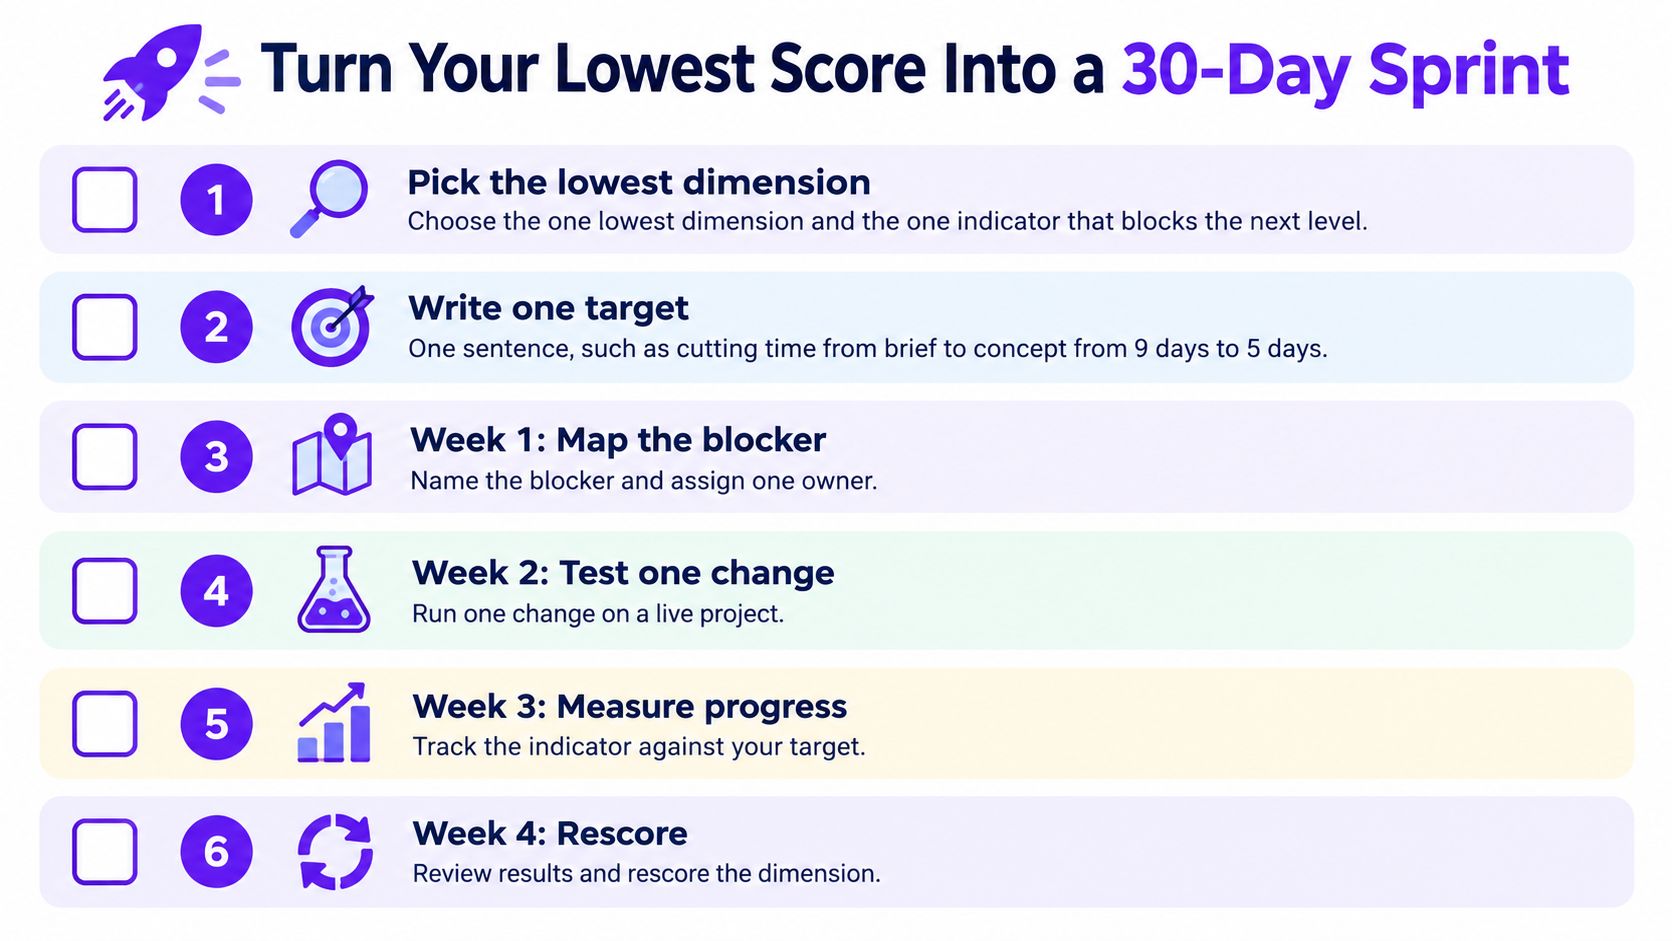
A maturity score is more useful as a map than as a label. It shows the capability that blocks the next level, so end with one small, dated plan: your one lowest dimension and the one indicator holding it down. That narrow focus is what makes a month enough.
Write the target in one sentence. For example, cut time from brief to concept from 9 days to 5 days. Avoid the most common wrong measure: counting ideas. A bigger pile can hide weak selection. Pair the target with habits from sound innovation management best practices so the sprint connects to your wider process.
This checklist lays out the sprint sequence at a glance.
Week by Week
Week 1 is for clarity. Write the problem statement, name one owner, and agree on the proof you will accept. The owner schedules the work, guards the target, and reports the indicator each week.
Weeks 2 and 3 are for one structured change on live work. Run one structured brainstorm with a mixed group so input is wider than usual. If diversity of input or idea selection is your weak point, Bulby can fit here: anonymous idea submission helps overcome biases that favor certain perspectives, and the 6-step flow moves from challenge and one-link invite to anonymous writing with AI-powered inspiration, an AI summary with actionable next steps, and a shared report. As Yngvi H., CEO, put it: "The possibility of constantly adding new challenges is a real advantage. It can keep our team engaged and ensure our focus remains sharp on the areas we want to find creative ideas around."
Week 4 is for proof. Select two concepts and test each with a small, real experiment. Keep the tests cheap and fast. You are checking whether the new process produces testable work, not launching a full campaign.
The short video below is a useful companion while you plan that first structured session.
The method works with any facilitation tool. The sprint is the point, and the platform is only support. When the month ends, rescore that one dimension and record the result beside your baseline. If the indicator moved and the outcome data agrees, keep the change and choose the next bottleneck. If it did not move, you still learned something specific, and the next sprint starts from evidence instead of hope.
Ready to lift your lowest dimension with wider input and clearer selection? Bulby guides your team through structured, anonymous brainstorming and turns the session into an AI summary with next steps you can test in your sprint. Start with one real challenge this week and let your next rescore show whether the change held.