
Your team has a launch decision on Friday. The survey says customers want the simplest option. Interviews reveal that they value control. Product analytics show that most users ignore advanced settings anyway. By Thursday afternoon, three departments are arguing over which result to trust, and the research deck has become a catalogue of contradictions.
A market research framework earns its place in this context. It isn't a list of methods to run in a fixed order. It's a decision system that helps a team define the choice, select evidence that fits the risk, reconcile conflicting signals, and turn findings into a defensible action.
Table of Contents
- What a Market Research Framework Does
- A Brief History of How the Framework Evolved
- Qualitative Versus Quantitative and Why You Need Both
- The Four Frameworks Worth Knowing by Name
- When Customers Say One Thing and Do Another
- An Evidence Threshold for Synthetic Respondents
- Turning Framework Output Into Briefs That Travel
What a Market Research Framework Does
A product team may need to choose a message, prioritize a feature, or decide whether a new segment deserves investment. Without a framework, research can produce a pile of interviews, survey charts, and behavioral metrics without clarifying which decision each piece should support. A market research framework works like a route plan: it begins with the destination, identifies the uncertainty blocking the journey, and selects evidence suited to that uncertainty.
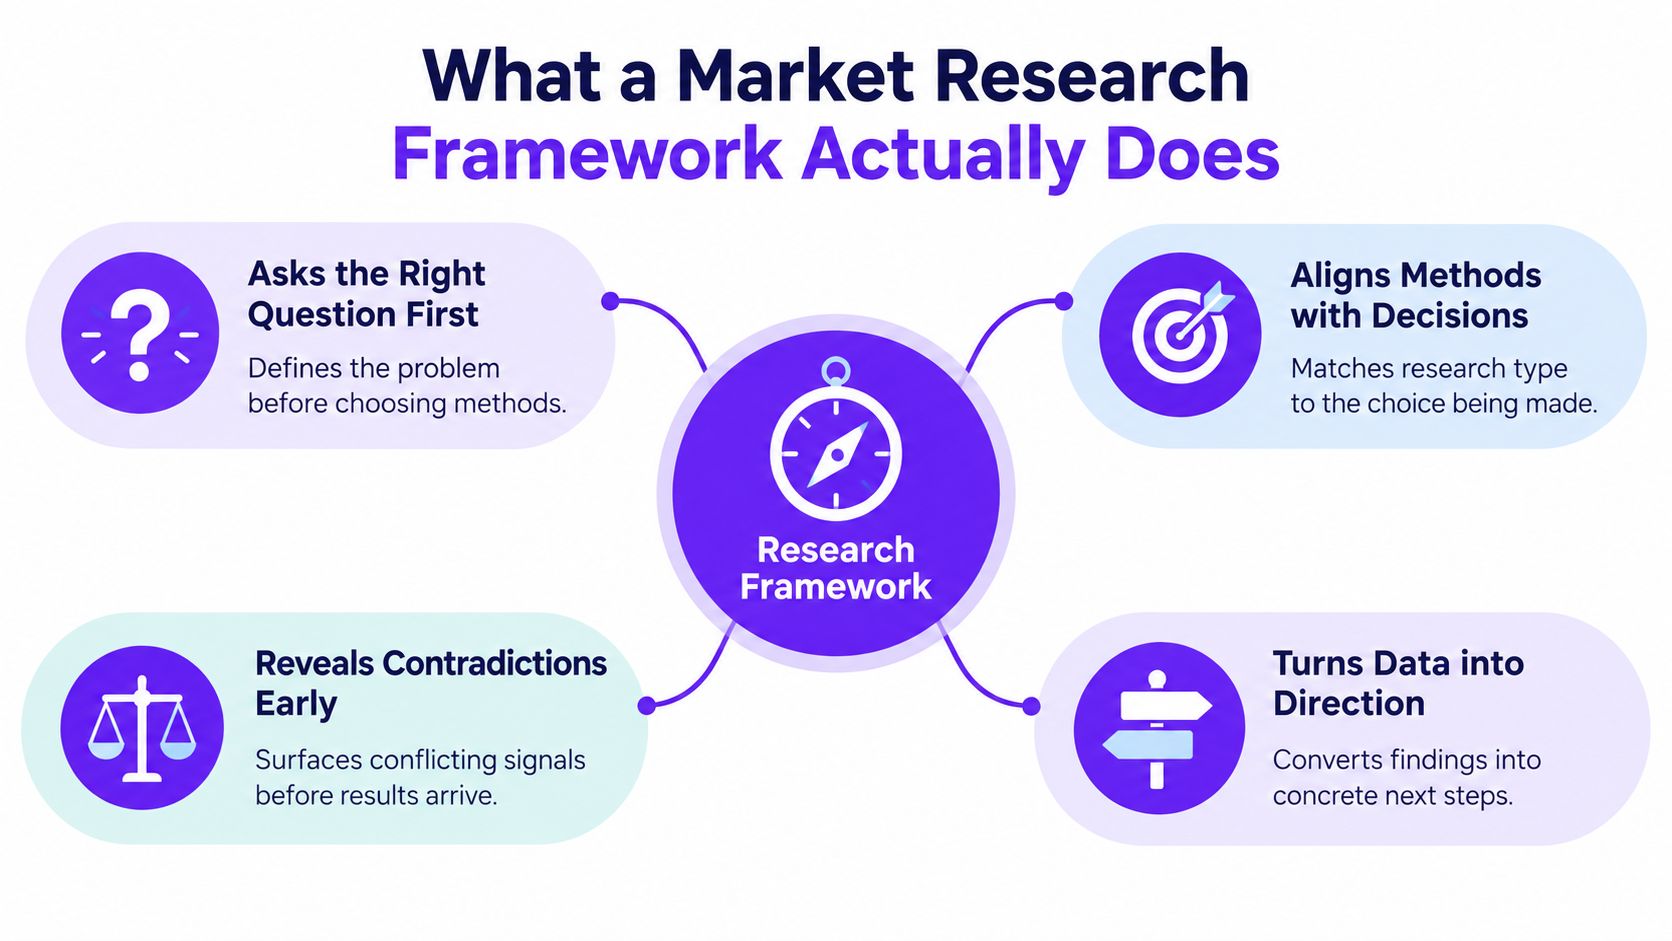
A useful framework has four jobs:
- Define the decision. Replace “learn more about customers” with a choice someone must make, such as selecting a message territory, prioritizing a feature, or deciding whether to enter a segment.
- Match methods to risk. Use interviews to uncover unfamiliar motivations, surveys to measure how widely a pattern appears, and experiments to test whether a change produces a behavioral outcome.
- Build a defensible position. Weigh evidence across methods instead of letting the loudest quote or most attractive chart determine the recommendation.
- Protect against room bias. Record assumptions, sample limitations, contradictory findings, and confidence before internal preferences reshape the conclusion.
The mapping matters more than the method list. If the decision concerns why customers hesitate, exploratory interviews may earn their place. If the question is how common that hesitation is, a survey provides a better test. If customers claim they prefer one experience but rarely use it, behavioral data or an experiment can challenge the stated preference. The framework gives each signal a defined role and creates a way to resolve disagreement rather than hide it.
Modern research practice separated problem definition, sampling, exploration, validation, analysis, and action over roughly a century of method development.
The four jobs in practice
| Job | Question it Answers | Failure if Skipped |
|---|---|---|
| Define the decision | What must the team choose? | Research produces interesting information with no owner |
| Match methods to risk | What evidence can reduce this uncertainty? | A survey or interview is asked to answer the wrong question |
| Build a defensible position | Which findings deserve weight? | One vivid comment overrules a broader evidence pattern |
| Protect against bias | What could distort the conclusion? | Internal preferences become disguised as customer insight |
Teams can review how to own all market research stages to connect the initial question with the final recommendation. A procedure for marketing research can also help document responsibilities, handoffs, and decision points.
A framework is working when the team can finish this sentence: “We are collecting this evidence so we can decide whether to…” If nobody can complete it, more data will not repair the underlying problem.
A Brief History of How the Framework Evolved
A team deciding whether to launch a product needs more than a list of research techniques. It needs to know which method can reduce the uncertainty behind that decision. The modern framework developed as each generation added a capability that addressed a weakness in earlier practice.
In the 1930s, random sampling helped researchers move beyond convenient respondents and estimate views from a broader population. In the 1940s, research became part of management decision-making, giving businesses a structured way to replace executive instinct with evidence about customers and markets.
The 1950s introduced experimental design and analysis of variance. Researchers could examine whether a change caused a different response, rather than only describing preferences. The 1960s added multivariate analysis and simulation, allowing analysts to study several influences together when a single-factor explanation failed.
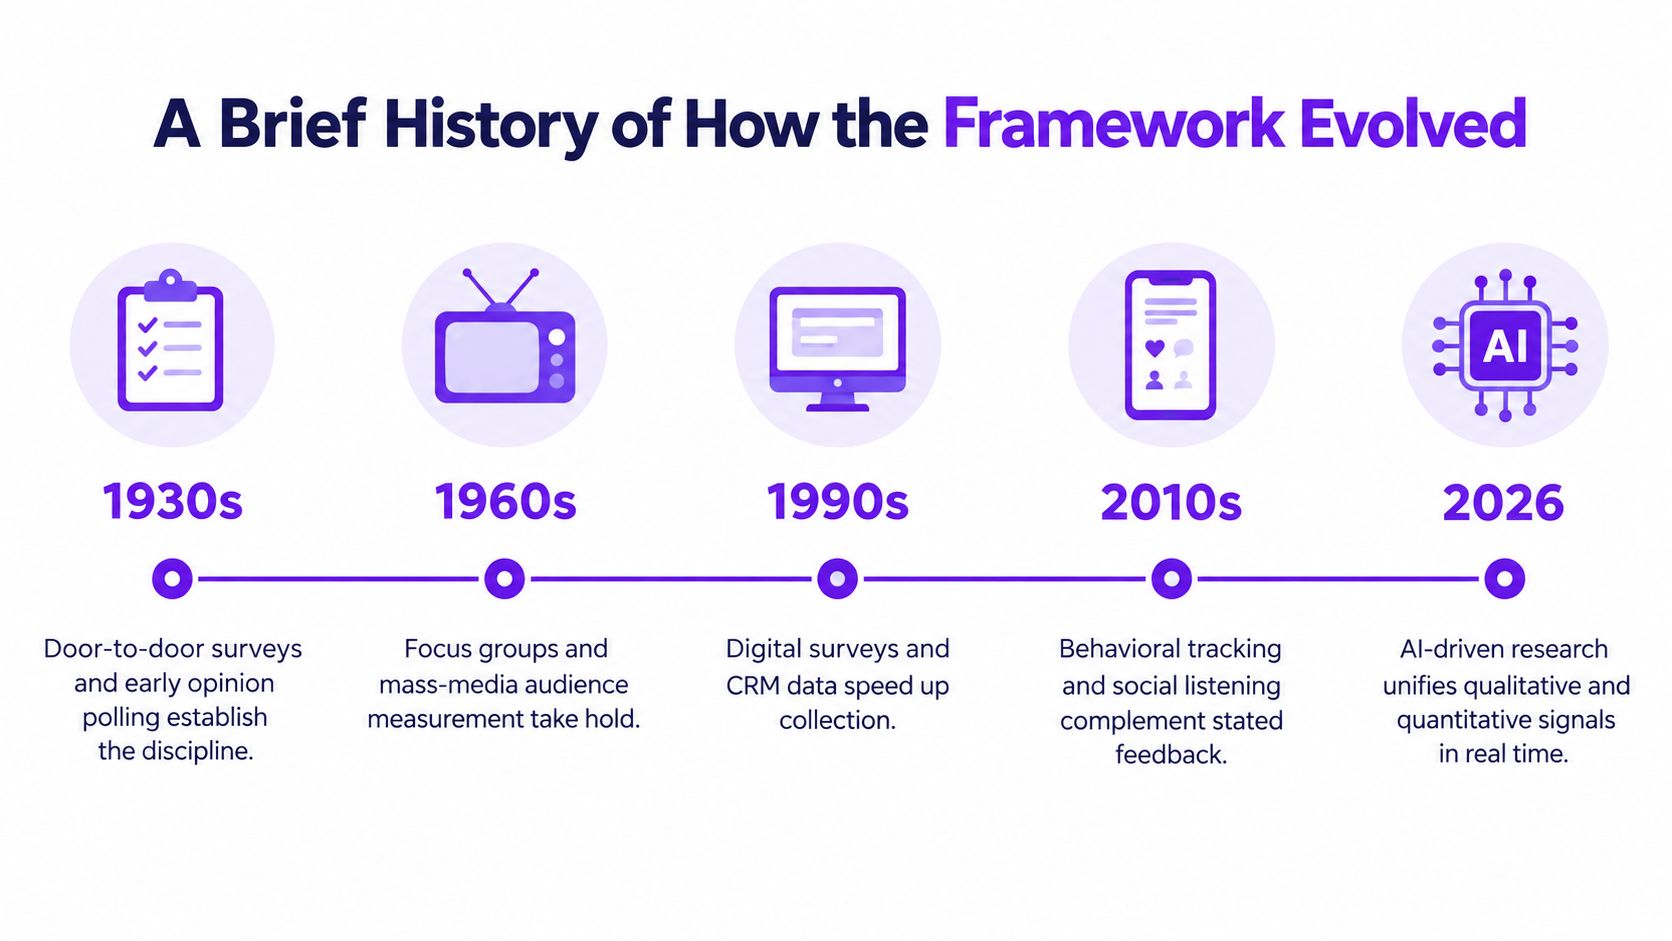
From 1980 to 1995, telephone interviewing expanded access to respondents, while conjoint and causal analysis helped teams evaluate trade-offs and test likely drivers of choice. These methods addressed a practical failure: knowing what people preferred without knowing which product features or messages would change the decision. After 1995, databases, data mining, and internet-based collection increased the speed and scale of research. Since 2010, very large datasets and data science have supported more connected analysis. The milestones are summarized in the development of market research over the past century, which provides historical context rather than a prescription for one method.
The strategic lesson is straightforward. Interviews can explain meaning but cannot establish prevalence. Surveys can measure reported preference but cannot, by themselves, prove behavioral change. Analytics can show what happened while leaving motivation unclear. When customer statements conflict with observed behavior, the framework should preserve the contradiction and assign each claim to the method best suited to test it.
Modern research therefore operates as an integrated system:
- Qualitative exploration identifies language, tensions, and hypotheses.
- Quantitative measurement estimates prevalence and compares groups.
- Experimentation tests cause and effect.
- Analytics and reporting connect evidence to decisions.
Synthetic respondents require the same discipline. Teams should pressure-test their outputs against observed customer evidence before trusting them. History matters because it shows why each method earns its place: it reduces a particular uncertainty and supports a specific business choice.
Qualitative Versus Quantitative and Why You Need Both
A bakery deciding whether to launch a new loaf needs two kinds of knowledge. A chef tasting the recipe can explain the texture, aroma, and aftertaste. Sales data from stores can show how often shoppers choose it, which locations perform differently, and whether the product competes successfully at the shelf.
That is the difference between qualitative and quantitative research. Qualitative work explores meaning and motivation. Quantitative work measures patterns across a defined sample.
What qualitative research is best at
Use interviews, ethnography, focus groups, observation, or open-ended questions when you don't yet understand the problem clearly. A conversation might reveal that customers aren't rejecting a budgeting app because they dislike tracking expenses. They may avoid it because the act of categorizing purchases makes them feel judged.
That insight gives the team language, emotional context, and a hypothesis to test. It can improve a survey question, expose an unmet need, or change the product problem entirely.
Qualitative research has limits. Articulate participants can dominate the narrative, and a compelling story can feel more representative than it is. A strategist should treat qualitative findings as explanatory evidence, not as a direct estimate of how common a behavior is.
What quantitative research is best at
Use structured surveys, behavioral analysis, segmentation, or conjoint when you need to measure incidence, compare alternatives, rank trade-offs, or estimate differences between groups. A survey can test whether the budgeting-app barrier appears across a target audience or only among people with a specific financial situation.
Quantitative work can also create false confidence. A clean chart won't repair a leading question, an unsuitable sample, or an answer choice that omits the true reason. Numbers become useful only when the team has defined what they represent and what they can't establish.
| Dimension | Qualitative | Quantitative |
|---|---|---|
| Main question | Why does this happen? | How often, how many, or which option leads? |
| Typical methods | Interviews, observation, focus groups, open text | Structured surveys, behavioral data, experiments, conjoint |
| Best output | Motivations, language, hypotheses | Prevalence, rankings, comparisons, modeled outcomes |
| Main risk | Overvaluing vivid or unusual participants | Producing precise answers to poorly framed questions |
Mixed-methods designs combine qualitative and quantitative collection, analysis, and inference to provide both depth and breadth. In a convergent design, teams collect both streams concurrently, analyze them separately, then merge the findings for corroboration, as described in this overview of mixed-methods research.
A strong sequence often begins with qualitative exploration, moves to quantitative measurement, and uses an experiment when the decision depends on causality. For teams looking to uncover content ideas with research, the same principle applies: first discover the language people use, then test which themes matter broadly. A practical guide to customer research types can help planners choose the right starting point.
The common mistake is asking one method to perform every job. Choose the method according to the uncertainty, not according to the tool your team happens to know best.
The Four Frameworks Worth Knowing by Name
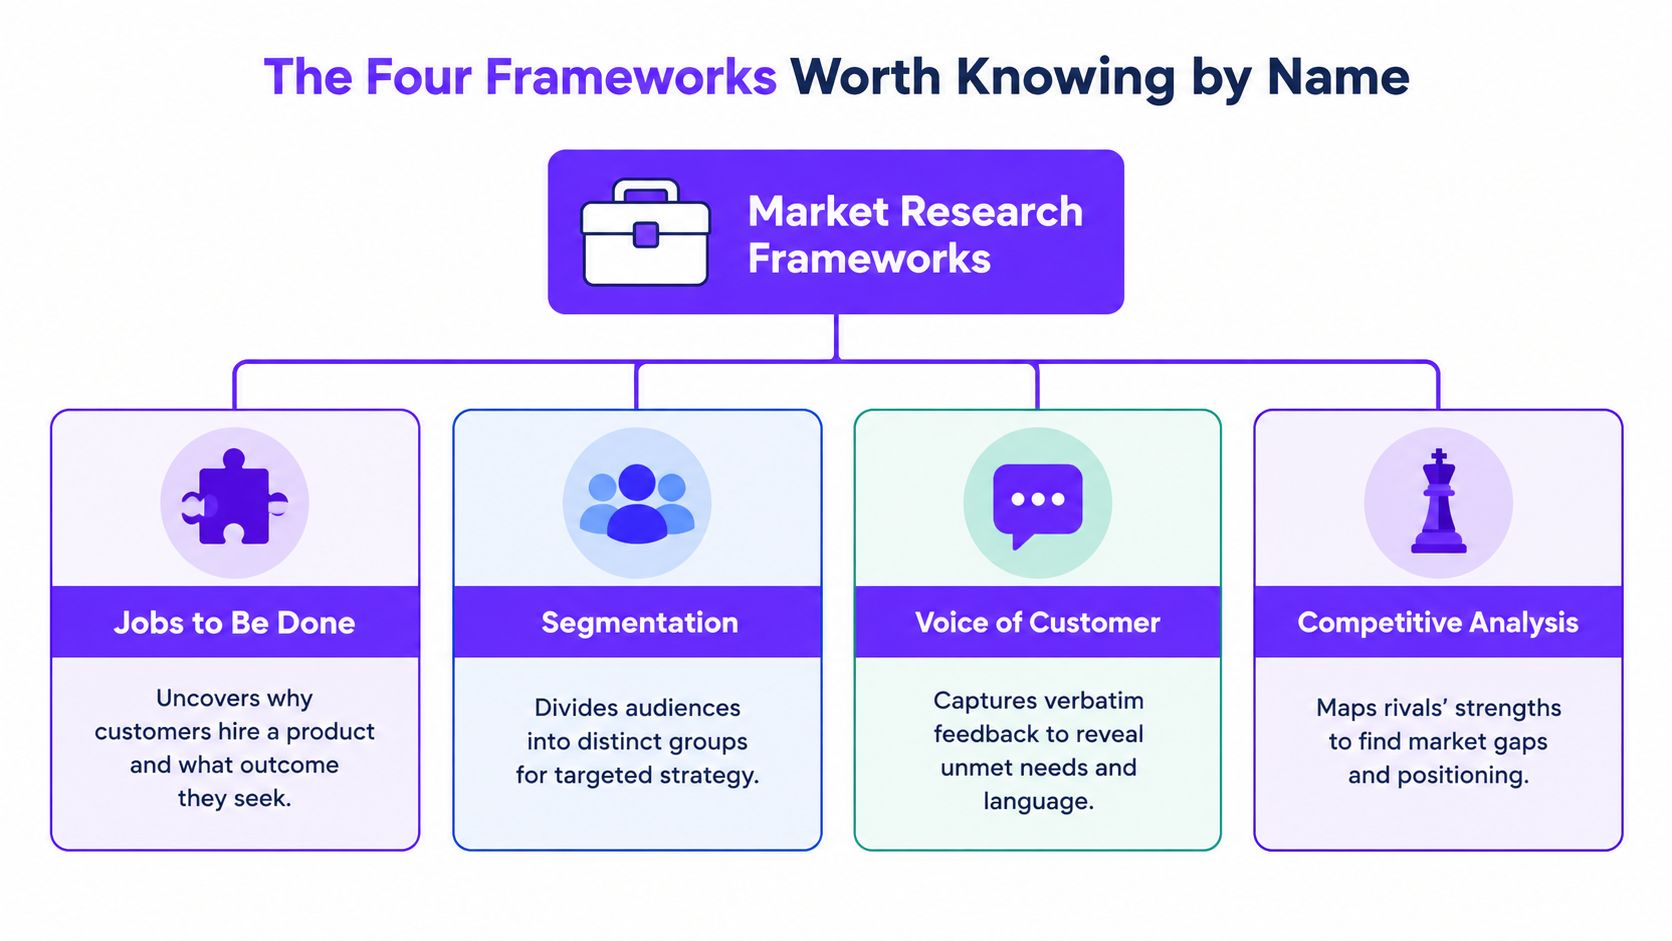
Specialized frameworks are useful when they turn a broad research brief into a sharper lens. They shouldn't become competing religions. Select one because it clarifies the decision in front of you.
Jobs to Be Done
Use it when: the team understands the product category but not the progress customers are trying to make.
Jobs to Be Done asks what customers are trying to accomplish in a specific situation, rather than treating demographics as the explanation. Someone may “hire” a meal-planning service to reduce weekday decisions, not just to eat healthier.
The output is a job statement, supported by circumstances, desired progress, barriers, and competing solutions. That gives a creative brief a human problem to solve and gives a product team a clearer outcome to design around.
Personas
Use them when: teams need a shared picture for storytelling, alignment, or brief writing.
A persona turns research into a practical character built around behaviors, context, needs, and constraints. It can help a content team write for a time-poor operations manager or help a designer understand why a first-time user hesitates.
Personas work best when grounded in evidence and connected to a decision. They shouldn't become fictional biographies that imply precision the research never established. The deliverable is a usable audience portrait, not a decorative profile.
Competitive analysis
Use it early when: the team hasn't defined the actual alternative customers compare against.
A competitor isn't always another company. It might be a spreadsheet, an internal process, a cheaper substitute, or the choice to do nothing. A competitive analysis maps claims, experiences, pricing logic, distribution, proof, and recurring weaknesses to reveal where a new offer could matter.
The output is a competitive map and opportunity territory. Running this work late often forces the campaign to repeat category language that customers already ignore.
Conjoint analysis
Use it when: customers must trade off features, benefits, packages, or price.
Conjoint should be designed as an end-to-end experiment. The team defines decision-relevant attributes and levels, selects a response format, creates an efficient stimulus design, estimates utilities, and translates those utilities into competitive simulations. The MIT Sloan conjoint analysis material describes this logic, including designs that reduce respondent burden while preserving the ability to estimate main effects.
For example, a software company might test storage, support, integrations, and subscription price together. Asking respondents to rate every feature independently can make everything look important. Trade-off tasks force choices closer to the decision the buyer faces.
The output is a prioritized feature and offer model, with simulations that can inform packaging, positioning, or pricing. Teams needing a broader framework for innovation can use these lenses as complementary tools rather than selecting one permanent method.
When Customers Say One Thing and Do Another
A shopper may tell an interviewer that sustainability determines the purchase, then choose a cheaper product at the shelf. A product user may say a feature is essential, then never open it. These aren't automatically dishonest answers. People report ideals, intentions, memories, and social expectations, while behavior reflects friction, timing, context, availability, and competing priorities.

Most framework explainers emphasize sequential methods but don't provide a clear way to reconcile these conflicts. This gap appears across multiple data sources, which is why a decision-oriented framework needs a contradiction protocol rather than another method list, as discussed in this analysis of synthetic data and market research.
Build an evidence ledger
Start with the decision and behavioral outcome. If the decision concerns retention, observed renewal behavior deserves more weight than a stated intention to stay. If the decision concerns brand meaning, interviews may explain associations that product logs can't reveal.
Record each important finding in an evidence ledger:
| Field | Example entry |
|---|---|
| Decision affected | Choose the onboarding message |
| Evidence source | Interview, product event data, survey |
| Market and audience | New users in the launch market |
| Recency | Date and collection context |
| Finding | Users praise flexibility but abandon setup |
| Confidence | Moderate, because the evidence streams disagree |
| Contradiction | Stated value is high, observed use is low |
| Next action | Test a simpler setup path before changing positioning |
The ledger prevents teams from averaging incompatible evidence into a meaningless conclusion. It also makes uncertainty visible to the client, product lead, or creative director.
Practical rule: Treat observed behavior as the stronger signal for habit, conversion, and retention questions. Use qualitative research to explain that behavior, and surveys to estimate how widely the explanation applies.
A smaller behavioral dataset paired with interviews can be more useful than a large, low-context survey. To improve observation work, use a defined method of observation that records the setting, task, friction, and outcome rather than relying on memory alone. Teams can also use interactive study tools for books to examine how judgment and decision biases may affect interpretation.
When evidence conflicts, the answer shouldn't be “collect everything again.” Ask which uncertainty matters to the decision, choose the method that can reduce it, and write the action that would follow from each possible result.
An Evidence Threshold for Synthetic Respondents
Synthetic respondents can help teams explore concepts quickly, but plausible language isn't proof of market demand. The critical question is not whether synthetic research exists. It's whether the evidence is strong enough for the decision being made.
A Qualtrics survey of more than 3,000 researchers across 14 countries found that 71% expect most market research to use synthetic responses within three years. That expectation makes governance more important, not less.
Match synthetic use to decision risk
Use a three-level classification:
- Low-risk exploration: Synthetic responses can help generate early concept directions, identify confusing questions, and refine interview or survey language. The output is a hypothesis, not a customer verdict.
- Directional screening: A mixed synthetic and human sample can support early segmentation or message screening. Keep the conclusion directional and validate the strongest options with real participants.
- High-consequence decisions: Use predominantly human evidence for pricing, brand safety, regulated categories, and launch commitments. These decisions depend on lived context, cultural nuance, and actual constraints that a model may not represent reliably.
Write the safeguards before the study
A defensible protocol should include:
- Holdout testing. Reserve human evidence that the synthetic process hasn't seen, then compare the synthetic prediction with observed responses.
- Subgroup error checks. Test whether performance changes across relevant demographic, behavioral, or market groups.
- Input disclosure. Record which real, public, or modeled inputs shaped the synthetic respondents.
- Model versioning. Preserve the model configuration and prompt conditions so the study can be reproduced.
- A stop rule. Pause synthetic use when synthetic and observed behavior diverge on a decision-critical outcome.
Synthetic responses should complement human evidence, not replace it. If a team can't explain what real-world evidence calibrated the synthetic output, what was held out for validation, and what would trigger a stop, it doesn't have an evidence threshold. It has a preference.
Turning Framework Output Into Briefs That Travel
Research becomes valuable when another team can use it without sitting through every interview or defending every chart. The handoff should preserve the decision, the behavior to change, the evidence supporting the recommendation, and the uncertainty that remains.
This matters in a growing insights industry. ESOMAR reported that the broader industry expanded from US$130 billion in 2022 to US$142 billion in 2023, and its reported composition reinforces the need to connect research questions with analytics, reporting, interpretation, and decisions in the Global Market Research report.
Translate evidence into brief inputs
Suppose research for a meal-planning product finds that prospective users want healthier meals but abandon setup when they must enter too many preferences. Interviews explain the emotional barrier, behavioral data shows where people leave, and a structured test compares two onboarding approaches.
The same evidence can serve two briefs. A campaign brief might focus on “healthy choices without another planning task.” An innovation brief might prioritize a shorter setup flow and default recommendations. The insight stays connected to the decision, but each team receives a different action.
| Framework | Primary Output | Lands in Brief As |
|---|---|---|
| Jobs to Be Done | Situation, desired progress, barriers | Human problem and behavior to change |
| Personas | Contextual audience portrait | Target audience and relevant tension |
| Voice of Customer | Repeated language and verbatim themes | Message vocabulary and proof points |
| Competitive analysis | Alternatives, gaps, category conventions | Positioning territory and reasons to believe |
| Conjoint analysis | Trade-off preferences and simulations | Feature priority, package, or offer logic |
| Behavioral analysis | Friction and observed actions | Experience problem and measurable outcome |
Use a short handoff format
A brief should state:
- Decision: What choice must the team make?
- Audience: Which people and situation matter?
- Behavior: What should people do differently?
- Insight: What tension or job explains the opportunity?
- Evidence: Which methods support the conclusion?
- Confidence: What is strong, directional, or unresolved?
- Contradictions: Where do stated and observed signals differ?
- Action: What should change in the product, campaign, or roadmap?
- Test: What will the team validate next?
A creative brief template can provide the structure, but the research team still has to fill it with decisions rather than observations. “Customers care about convenience” is an observation. “Reduce setup effort and make convenience the lead promise” is a strategic direction.
Before fieldwork begins, run this checklist:
- Name the decision: Write the choice in one sentence.
- Define the risk: Identify what would make the decision expensive or difficult to reverse.
- Select the method: Match interviews, surveys, observation, analytics, or experiments to the uncertainty.
- Plan contradictions: Decide how stated preference and behavior will be compared.
- Set the synthetic threshold: Specify where synthetic evidence is exploratory, mixed, or unacceptable.
- Design the handoff: Decide which fields the final brief must contain.
- Assign the owner: Name who will act on the findings and by when.
A strong market research framework doesn't end with a polished deck. It ends when the strategist, product manager, or creative team can explain what changed, why the evidence supports it, and what will be tested next.
Bulby helps marketing agencies, creative teams, and brand strategists turn research inputs into structured brainstorming, sharper campaign concepts, and actionable creative directions. Visit Bulby to pressure-test findings with guided exercises before they become another static research deck.